The AntV chart MCP is an MCP server chart tool that lets Claude Code turn a CSV file into a finished chart image. You ask in plain English, Claude picks the chart type, and you get a link to a picture. This guide shows three real charts, the token cost, and the one fact you should know before you use it: the drawing happens on a remote service.
This guide is part of our Claude Code tutorials. Find more servers in our MCP servers directory.
Tested with Claude Code v2.1.322 on November 12, 2026, using the @antv/mcp-server-chart npm package pinned at version 0.9.10 from antvis/mcp-server-chart at commit e2a8fb7. The package lists github.com/antvis/mcp-server-chart as its repository. That repo uses the MIT license and was not archived.
The latest commit there was made on August 27, 2026, and npm shows the package was last updated on September 21, 2026.
The npm metadata showed no install scripts. We opened the published package and read its source before running it. We did not compare it with the repo line by line, so treat the version number as the thing we pinned.
The server is free and needs no account or key, but it does not draw charts on your Mac. Your chart data is sent to a remote service, so we used made-up numbers only.
Quick Summary: What We Tested
| Question | Answer |
|---|---|
| What is it? | An MCP server from the AntV team that gives Claude Code 27 chart and diagram tools |
| Does it need an account or key? | No. It starts with npx and the README calls the chart service free by default |
| Where are charts drawn? | On a remote service. The package source points to antv-studio.alipay.com |
| What did we run? | Adding the server, the tool list, three charts from two small CSV files, and a /context check |
| Context cost | About 22.7k tokens for all 27 tool definitions, held back until needed |
| Our verdict | Quick and accurate for simple charts. Not for private or sensitive data |
One honest note. We ran each step once on tiny files with 12 and 4 rows, so treat the results as one demo and not a benchmark.
What the AntV Chart MCP Is and Why It Exists
MCP is the Model Context Protocol, a standard way to give Claude extra tools. If it is new to you, our MCP guide explains it from the start.
AntV is a data visualization project, and this server wraps its chart tools. Per the README, it is a TypeScript MCP server with more than 25 chart types, and you can use it from Claude Code, Cursor, VS Code and other clients.
Why use it? Claude Code can already write a Python script that draws a chart.
That works, but it needs a charting library on your machine and a few rounds of fixing code. With this server, Claude calls one tool and hands you an image link.
The tools cover the usual suspects like line, bar, column, pie and area charts. They also cover less common ones such as a Sankey chart, a word cloud, a funnel, a fishbone diagram and a mind map.
Does the AntV MCP Server Send Your Data Away?
Yes, and this is the main thing to understand. Our test is where we saw it, and the README confirms it.
The README says the server provides a free chart generation service by default. It also says that people who need a private deployment can set an environment variable named VIS_REQUEST_SERVER to point at their own service.
We read the package source to see what the default is.
In build/utils/env.js the default address is https://antv-studio.alipay.com/api/gpt-vis. The image links Claude gave us in the test came from a different host, mdn.alipayobjects.com, which looks like where the service stores the finished pictures. The README does not describe that storage, so we cannot say how long an image stays up.
What does that mean for you?
The numbers in your chart travel to a service run by someone else. For a CSV of public figures that may be fine. For customer data, salaries or anything under a privacy rule, it is a reason to stop or to host the service yourself.
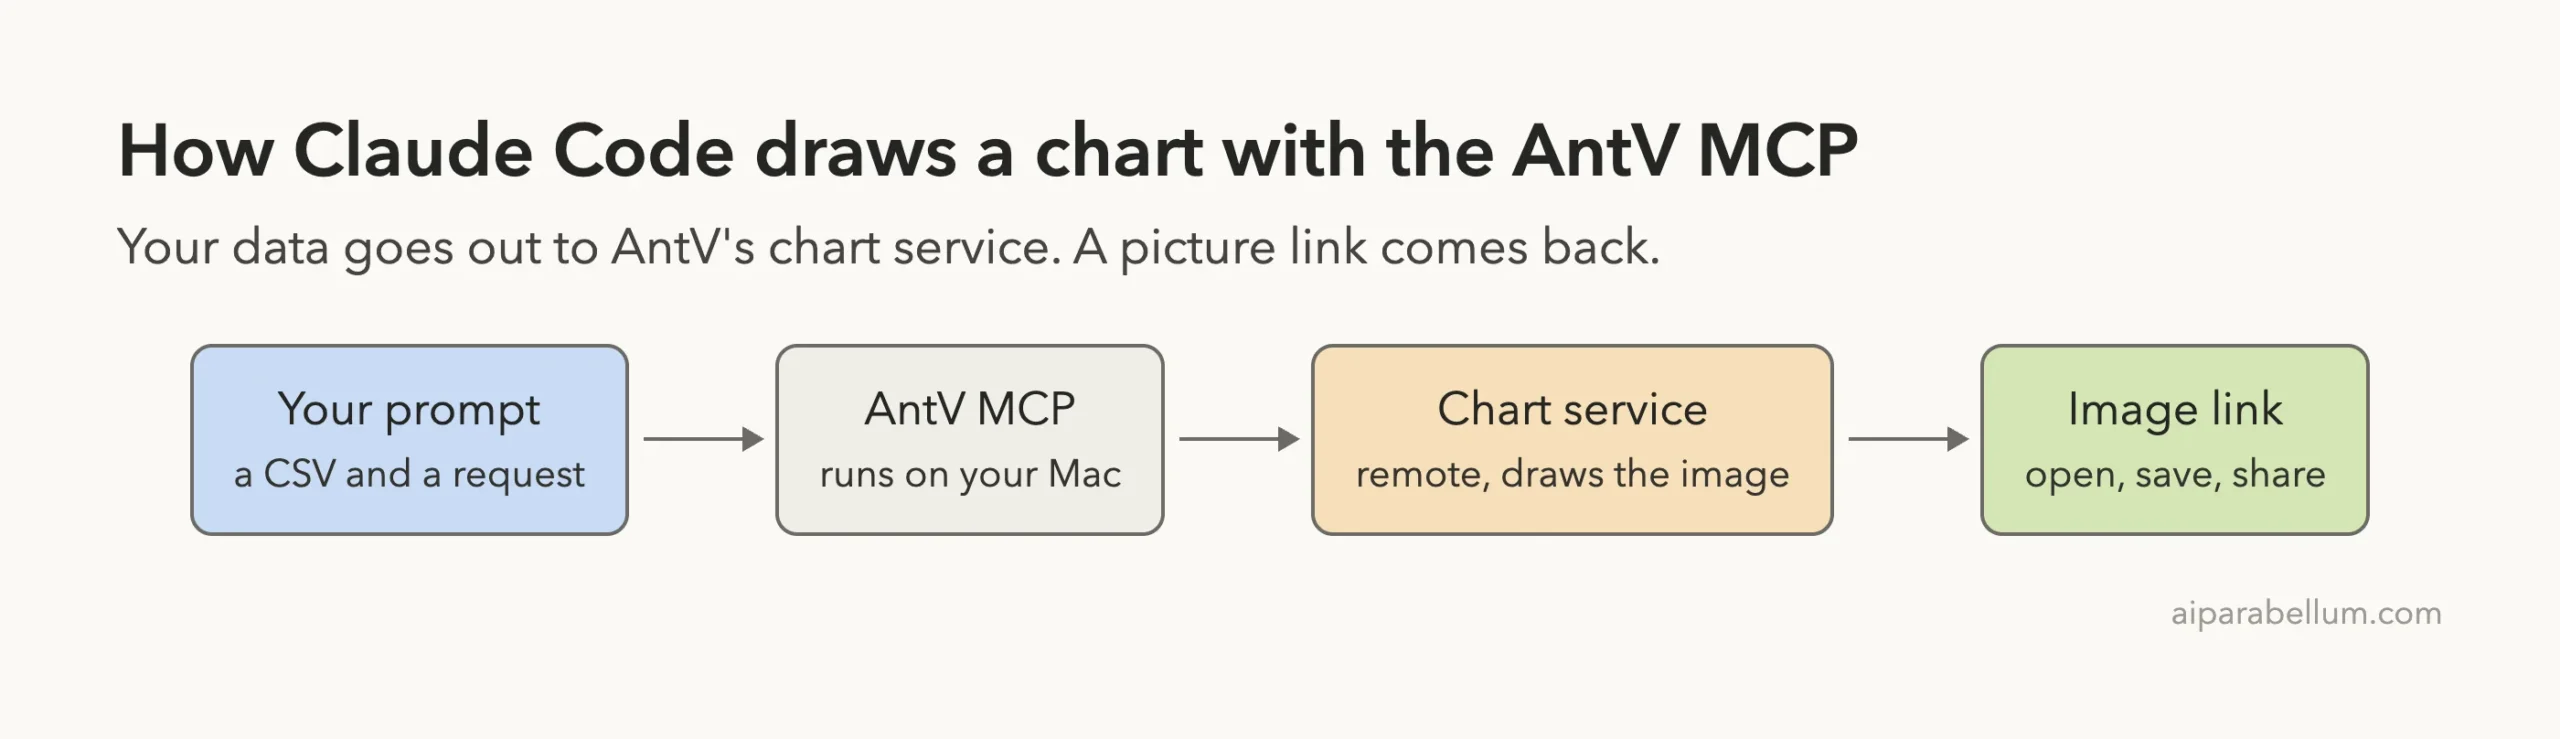
The README also says the private option does not support the three map tools. We did not test a private deployment.
How to Add the AntV Chart MCP to Claude Code
We worked in a throwaway demo folder and used local scope, so the server exists only in that folder. We also pinned the version, so a later release cannot change what runs. Your normal setup stays unchanged.
First we made two small files with invented numbers. The file sales.csv has 12 rows with a month, a region and a revenue figure. The file channels.csv has 4 rows with a traffic channel and a visitor count.
Then we added the server with one command.
claude mcp add --scope local antv -- npx -y @antv/[email protected]The part after -- is the command Claude Code runs to start the server. The general steps for any server are in the MCP quickstart, and scopes are explained in the MCP docs.
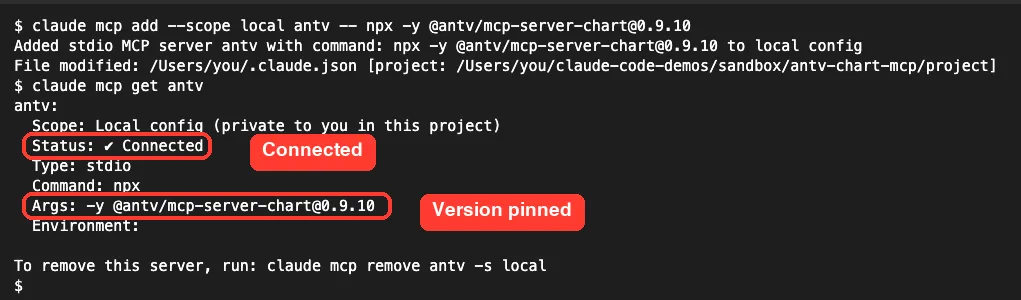
No sign-in prompt and no key. The claude mcp get antv command shows the stored command, so you can double-check what will run.
The 27 Tools Claude Code Sees
We started claude in the folder and ran /mcp. The antv entry showed as connected with 27 tools.

| Group | Tools from the list |
|---|---|
| Everyday charts | line, bar, column, area, pie, scatter, histogram |
| Comparisons | radar, funnel, waterfall, dual axes, boxplot, violin |
| Flows and structure | sankey, flow diagram, mind map, organization chart, fishbone, network graph, treemap, venn |
| Other | word cloud, liquid chart, spreadsheet |
| Maps | district map, path map, pin map |
The README says the three map tools use the AMap service and only support maps within China. We did not run them.
What It Costs in Context
Every MCP server adds tool definitions to your session, and 27 tools is a lot. We ran claude -p "/context" in the demo folder to see what the server added.
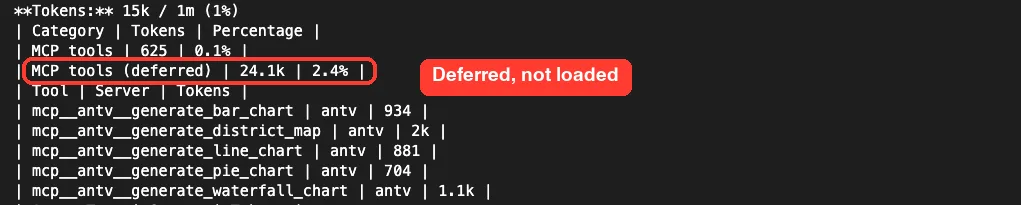
The listing gave each tool its own number, from 605 tokens for the flow diagram tool to 2k for the district map. Adding them up gave about 22.7k tokens. The summary line for deferred MCP tools read 24.1k, which also counts a few tools from another connector in our setup.
The loaded MCP tools line read 625 tokens. That tells us Claude Code held the antv definitions back and fetches them only when a request needs a chart. We did not test how that changes in a client without this deferred loading.
A fair caution: the 22.7k figure is our sum of rounded numbers. If your plan counts tokens against a limit, measure it in your own session. Our context window guide explains what these numbers mean.
Test 1: A Line Chart From a CSV
We allowed only the antv tools and the file reader with --allowedTools mcp__antv,Read. Claude Code would ask before using anything else. Then we asked for our first chart.
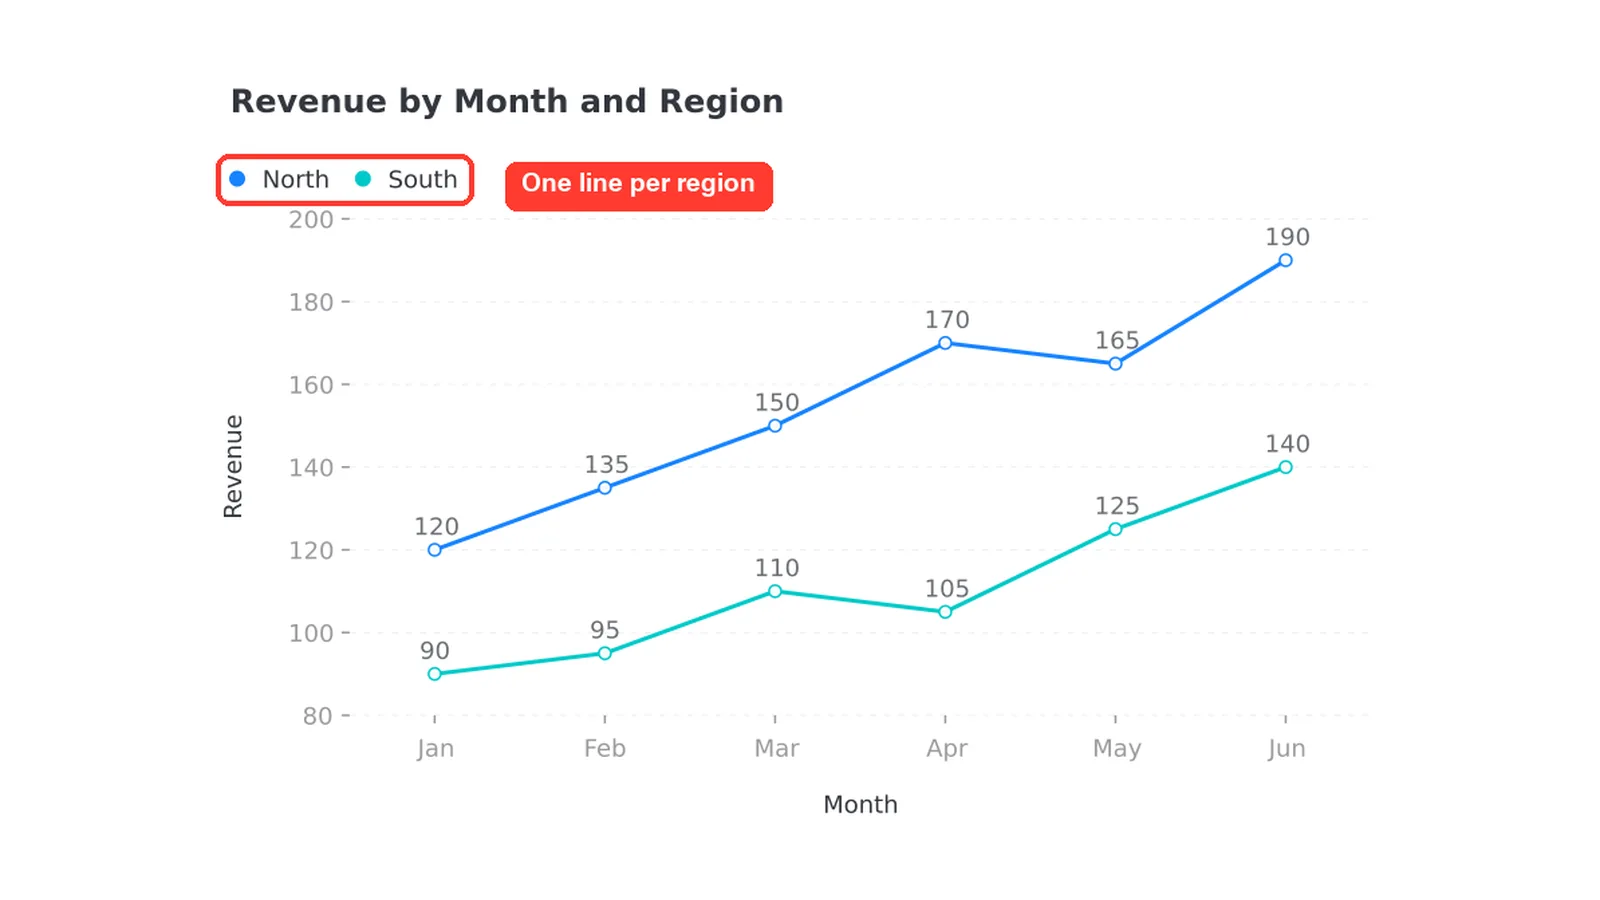
Read sales.csv and make a line chart of revenue by month with one line per region using the antv chart tool. Reply in 2 short lines and show the chart image URL on its own line.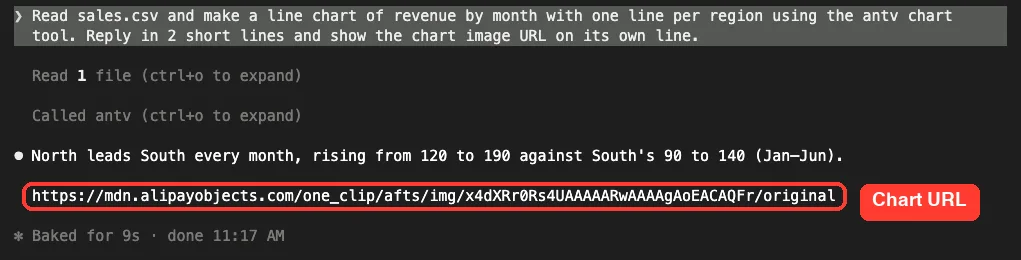
The whole round trip took 9 seconds by the timer in the screenshot. We opened the link in a browser.
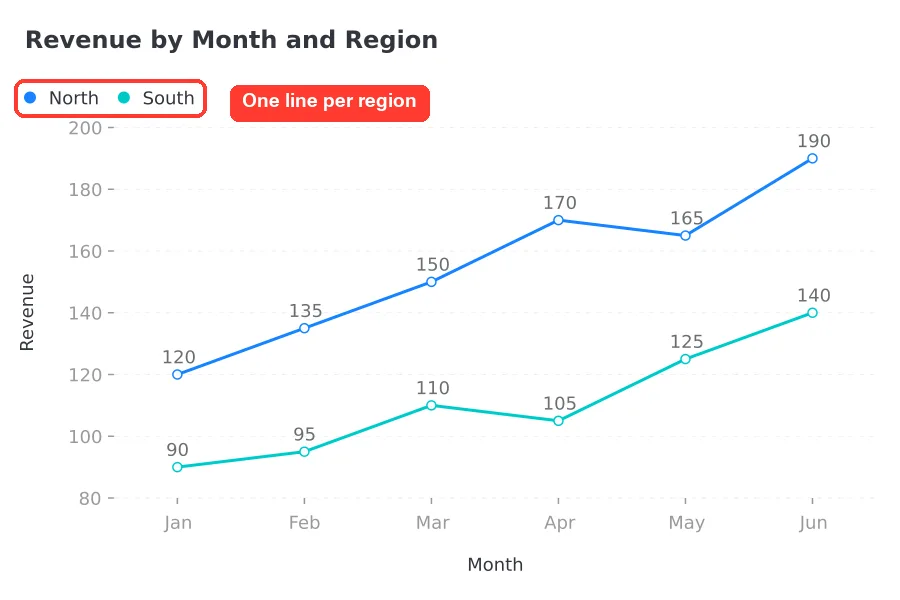
The chart had one blue line for North and one teal line for South, with the value written on each point. We checked it against our CSV. Every one of the 12 points matched, from North at 120 in January to 190 in June, and South from 90 to 140.
Claude chose the title, the axis names and the colors on its own. We did not ask for any of that.
Test 2: A Pie Chart
Next we asked for a different chart type from the second file.
Read channels.csv and make a pie chart of visitors by channel using the antv tool. Reply in 2 short lines and show the chart image URL on its own line.Claude answered that Search drives the most visitors at 4,200 of 10,000, or 42 percent, followed by Social at 26 percent. That is correct: the four rows add up to 10,000, and 2,600 is 26 percent of that.
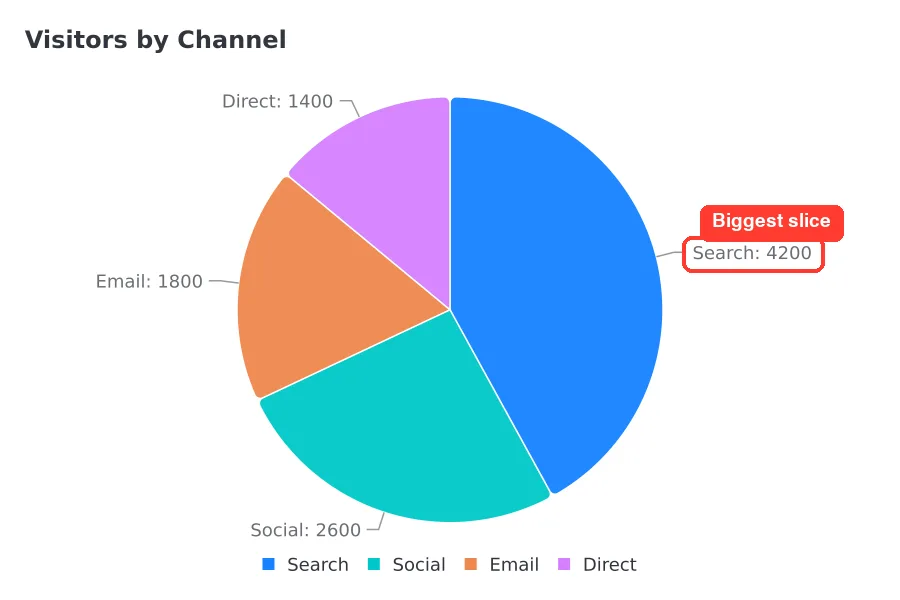
The labels showed the raw counts, not percentages. That is a style choice we could have changed by asking.
Test 3: A Bar Chart That Needs Math
The third prompt did not give Claude a ready-made table. It needed to add up a column first.
Make a bar chart of total revenue per region from sales.csv using the antv tool. Reply in 2 short lines and show the chart image URL on its own line.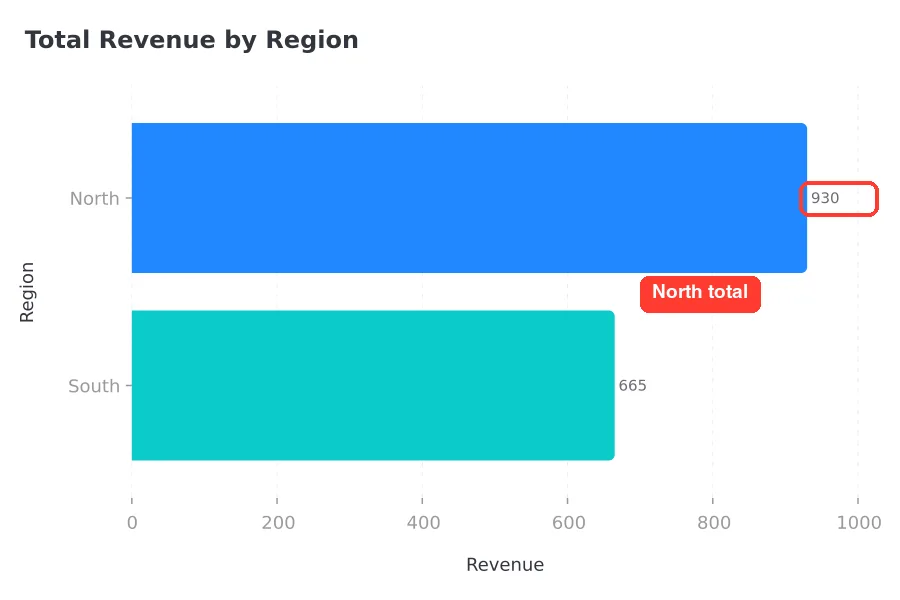
Claude reported that North totals 930 against South at 665, a gap of 265.
We checked the math. North is 120, 135, 150, 170, 165 and 190, which add up to 930. South is 90, 95, 110, 105, 125 and 140, which add up to 665.
So the server drew the chart, and Claude did the arithmetic before calling it. The chart is only as good as the numbers Claude passes in, so it is worth spot-checking totals like we did.
The Mistake That Cost Us a Re-Run
Our first attempt asked Claude to also append each image link to a text file. That sent Claude to a shell command, and Claude Code stopped to ask for permission because we had not allowed it.
Our scripted session did not answer the prompt, and a later question got cut off in the confusion. The charts themselves were fine. The test run was a mess.
We started over with a simpler prompt: just show the link in the reply. The takeaway is that a small side request can pull in a tool you did not allow. If you use --allowedTools, keep each prompt inside those tools.
Is the AntV Chart MCP Safe to Add?
Ask what a server can do and where your data goes. This one runs locally through npx, and in our test it only handled the data we passed into a chart request.
The risk is the remote service. Anything Claude puts in a chart request leaves your Mac. The tool descriptions are marked read-only in Claude Code, which is good, but that label is about your files and not about where the numbers go.
Our advice is simple. Use made-up or public data, or deploy the private rendering service the README points to. Never chart customer lists, health data or finance numbers you must keep in-house.
We also used a pinned version and local scope, and read the package source before running it. We saw nothing that ran outside the chart calls, but we did not audit every line.
What We Could Not Test
- We ran 3 of the 27 tools: line, pie and bar. The other 24 are untested.
- We did not run the three map tools, which the README says work only inside China.
- We did not set up a private service with
VIS_REQUEST_SERVER. - We did not test the
SERVICE_IDoption for viewing past chart records, or theDISABLED_TOOLSoption. - We did not test the separate chart-visualization skill the README mentions, or the SSE and HTTP transports.
- We did not check how long an image link stays online.
Who Should Add the AntV Chart MCP to Claude Code?
| Your situation | Our advice |
|---|---|
| You make quick charts from public or sample data | Add it. It took one command and three answers in a row |
| You want a Sankey, funnel or mind map without code | Add it. Those chart types are the strength of the list |
| Your data is private or regulated | Skip the default service. Host your own or use a local plotting script |
| You worry about token use | It is deferred here, but 27 tools is a lot, so check /context |
| You need charts inside a report file | You get a link, not a file, so plan to download the image yourself |
Common Mistakes
- Sending real customer or company numbers to the default chart service.
- Adding the server at user scope for a quick test. Use
--scope localto keep it in one folder. - Leaving the version unpinned, so
npxcan pull a newer release later. - Adding side tasks to a prompt when you have limited the allowed tools.
- Trusting totals without a check. Claude does the math before the chart tool runs.
- Forgetting to remove the server when the test is done.
Pro Tips
- Say the chart type you want. Claude picks one if you do not, and it may not be your choice.
- Ask for percentages or a title in the prompt if the default labels are not what you need.
- Run
/mcpto confirm the server is connected and see its tool count. - Allow only the tools you need with
--allowedTools, and keep prompts inside them. - Save the image yourself if you need it later, since we do not know how long the link lives.
Try It Yourself
Run this in a throwaway folder with a small CSV of made-up numbers. Remove the server when you are done.
claude mcp add --scope local antv -- npx -y @antv/[email protected]
claude
# inside Claude Code:
Read my CSV and make a line chart of the trend over time using the antv chart tool. Then tell me in 2 lines what the chart shows and show the image URL.
# when finished:
claude mcp remove antv -s local
Cheat Sheet
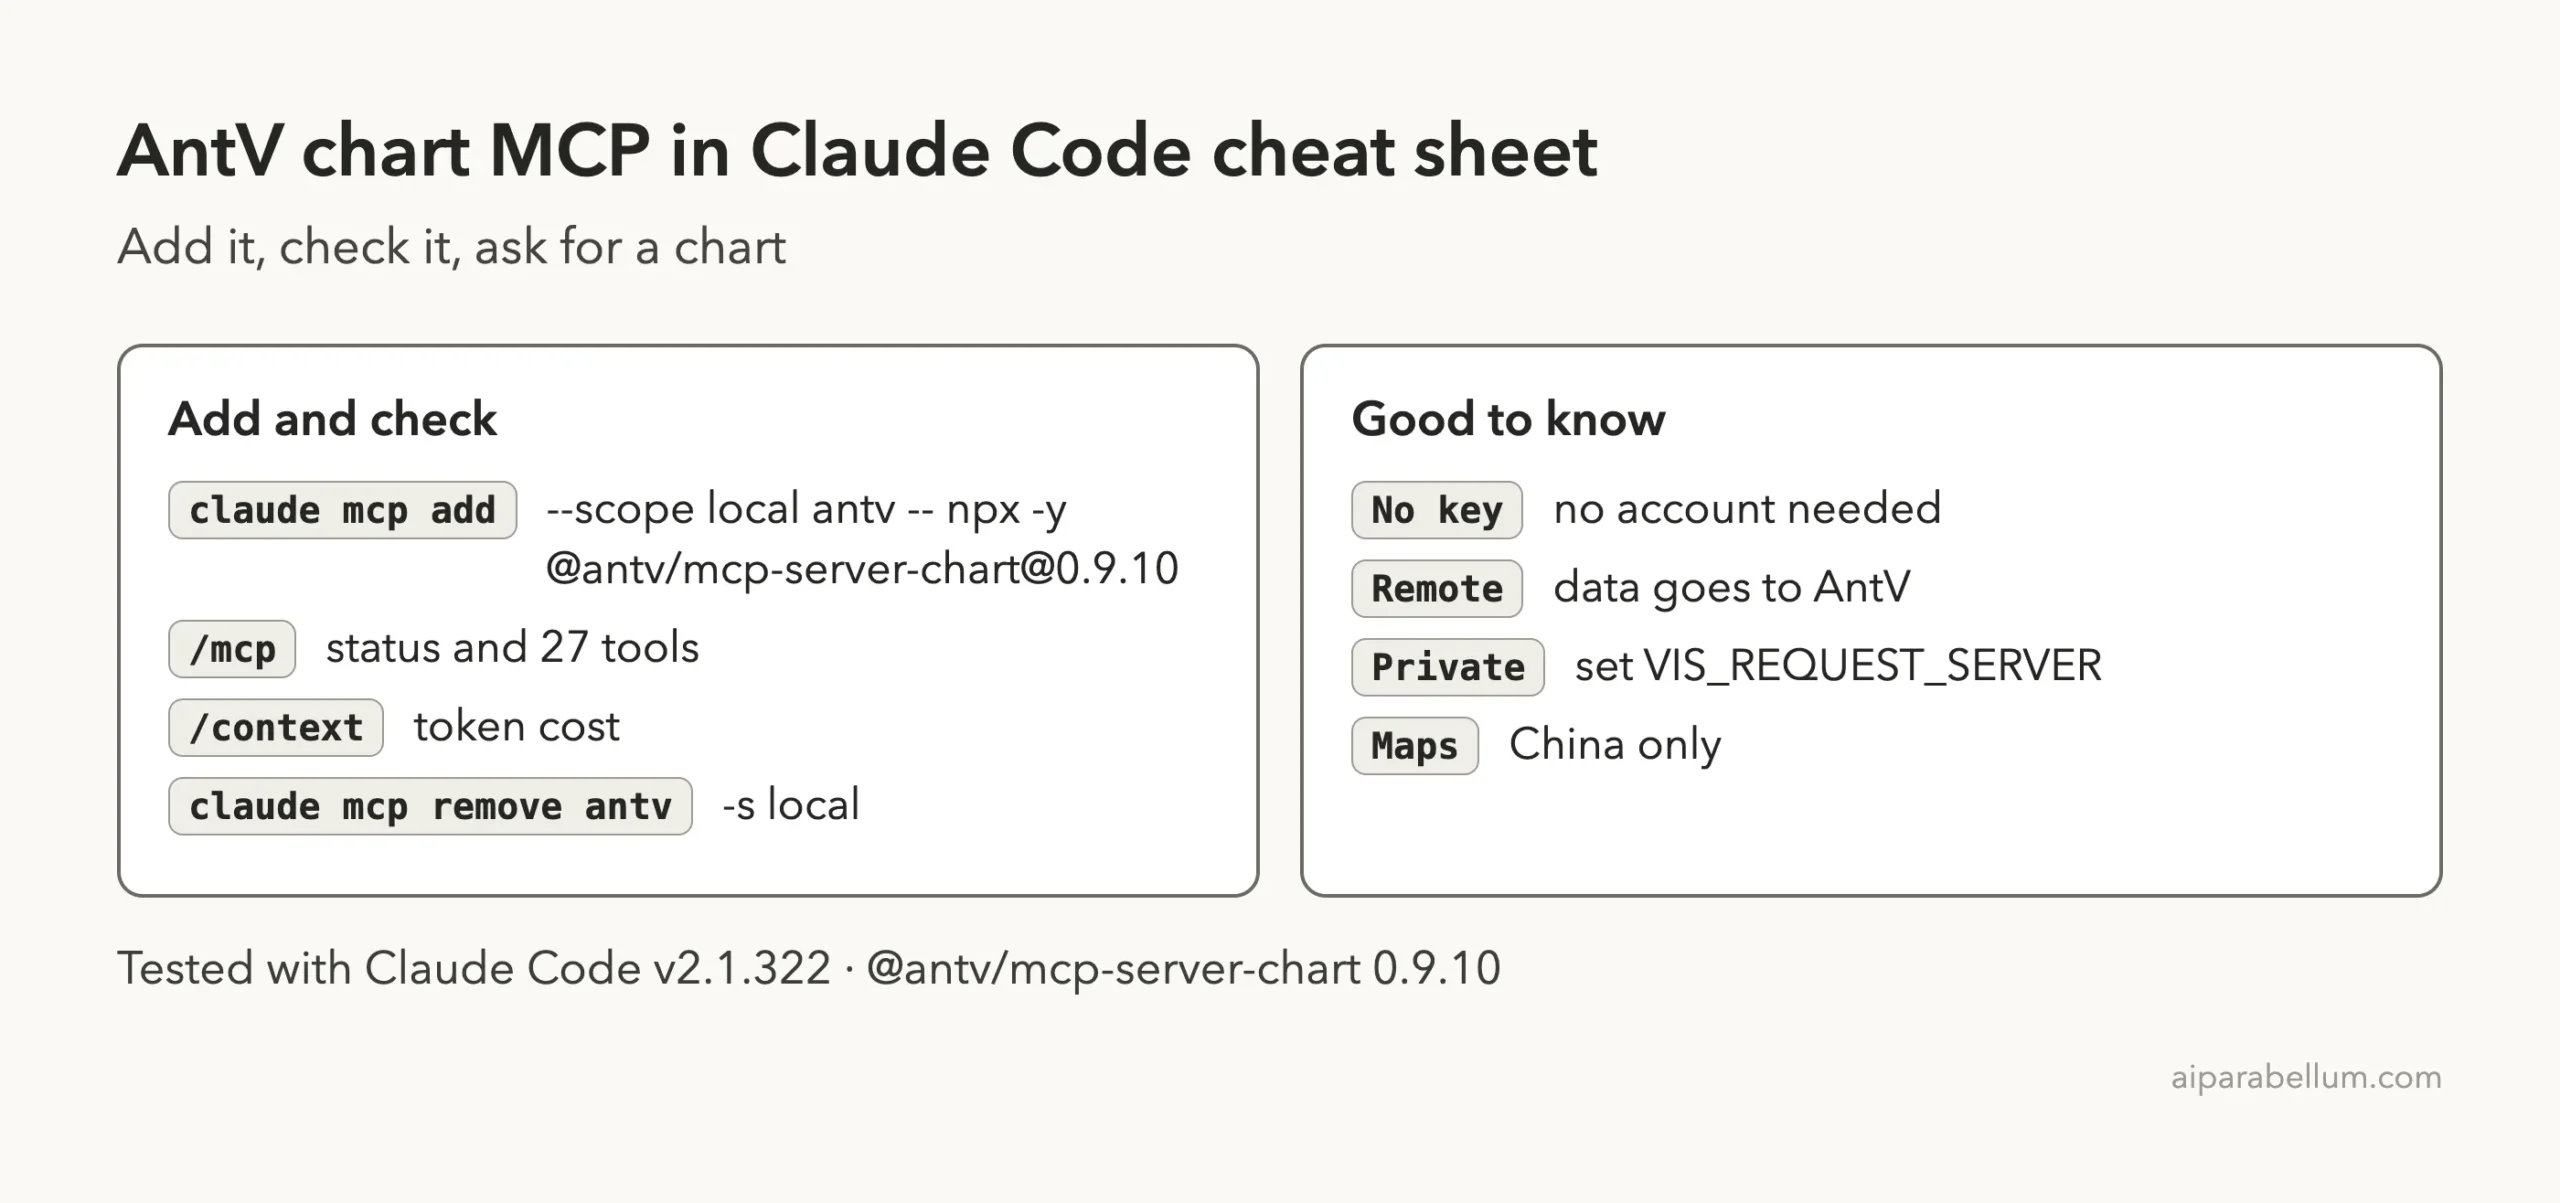
Frequently Asked Questions
Does the AntV chart MCP need an account or API key?
No. It runs through npx and the README calls the chart service free by default. We signed in to nothing.
Where are the charts drawn?
On a remote service. The package source defaults to antv-studio.alipay.com. The README says you can point to your own service with VIS_REQUEST_SERVER.
How much context does it use?
Adding the per-tool numbers from /context gave about 22.7k tokens for all 27 tools. They were listed as deferred, and the loaded MCP tools line read 625 tokens.
Can I use it for private data?
Not with the default service, since your numbers are sent out. Use made-up data, or deploy your own rendering service first.
How do I remove it?
Run claude mcp remove antv -s local from the folder where you added it.
Conclusion
The AntV chart MCP is easy to add, needs no account, and drew three correct charts from small CSV files in under ten seconds each. Claude chose sensible titles and labels, and every number matched our files. The catch is that the default service is remote, so your data leaves your Mac, and 27 tools add roughly 22.7k tokens of definitions that Claude Code defers until needed. Use it on public or sample data, and look at a private deployment before you try anything sensitive.
Next, browse more tested add-ons in our skills directory, or read our Claude overview.