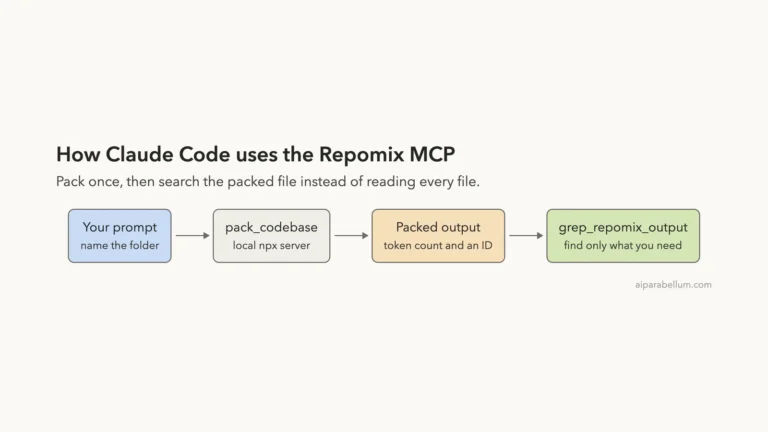
The Codebase Memory MCP is a local server that turns your code into a searchable graph of functions, classes and calls, so an AI assistant can ask “who calls this?” without reading every file. We added it to Claude Code, indexed a small public project, and checked its answers against plain grep. This guide shows the real numbers, including a comparison where the graph did not save anything.
This guide is part of our Claude Code tutorials. Find more servers in our MCP servers directory.
Tested with Claude Code v2.1.322 on November 12, 2026, using codebase-memory-mcp 0.12.1 from DeusData/codebase-memory-mcp at commit a7158ac, installed as the npm package pinned at that version. The repo uses the MIT license, was not archived, and had a push the day before our test.
The server is local, needs no account or key, and found all 16 callers of a helper function in our test project, the same 16 that a plain search found. On a repo this small it saved no tokens.
Quick Summary: What We Tested
| Question | Answer |
|---|---|
| What is it? | An MCP server that builds a local code knowledge graph, with 17 tools |
| Does it need an account or key? | No. Indexing and queries run on your machine |
| What did we run? | Adding the server, listing tools, indexing one repo, a callers query, a call trace, and a comparison run |
| Index size | 426 nodes and 1,136 edges for a project of 1,176 lines of source code |
| Context cost | About 8.2k tokens for the 17 tool definitions, as measured with /context |
| Accuracy | 16 of 16 callers matched a manual grep check |
| Our verdict | Works well and is easy to add. Worth trying on a large repo. Little reason to use it on a small one |
One honest note. We ran each step once on one project, so treat the numbers as one demo and not a benchmark.
What the Codebase Memory MCP Is and Why It Exists
Claude Code finds code by searching and reading files. That works, but on a big project each question can mean many file reads.
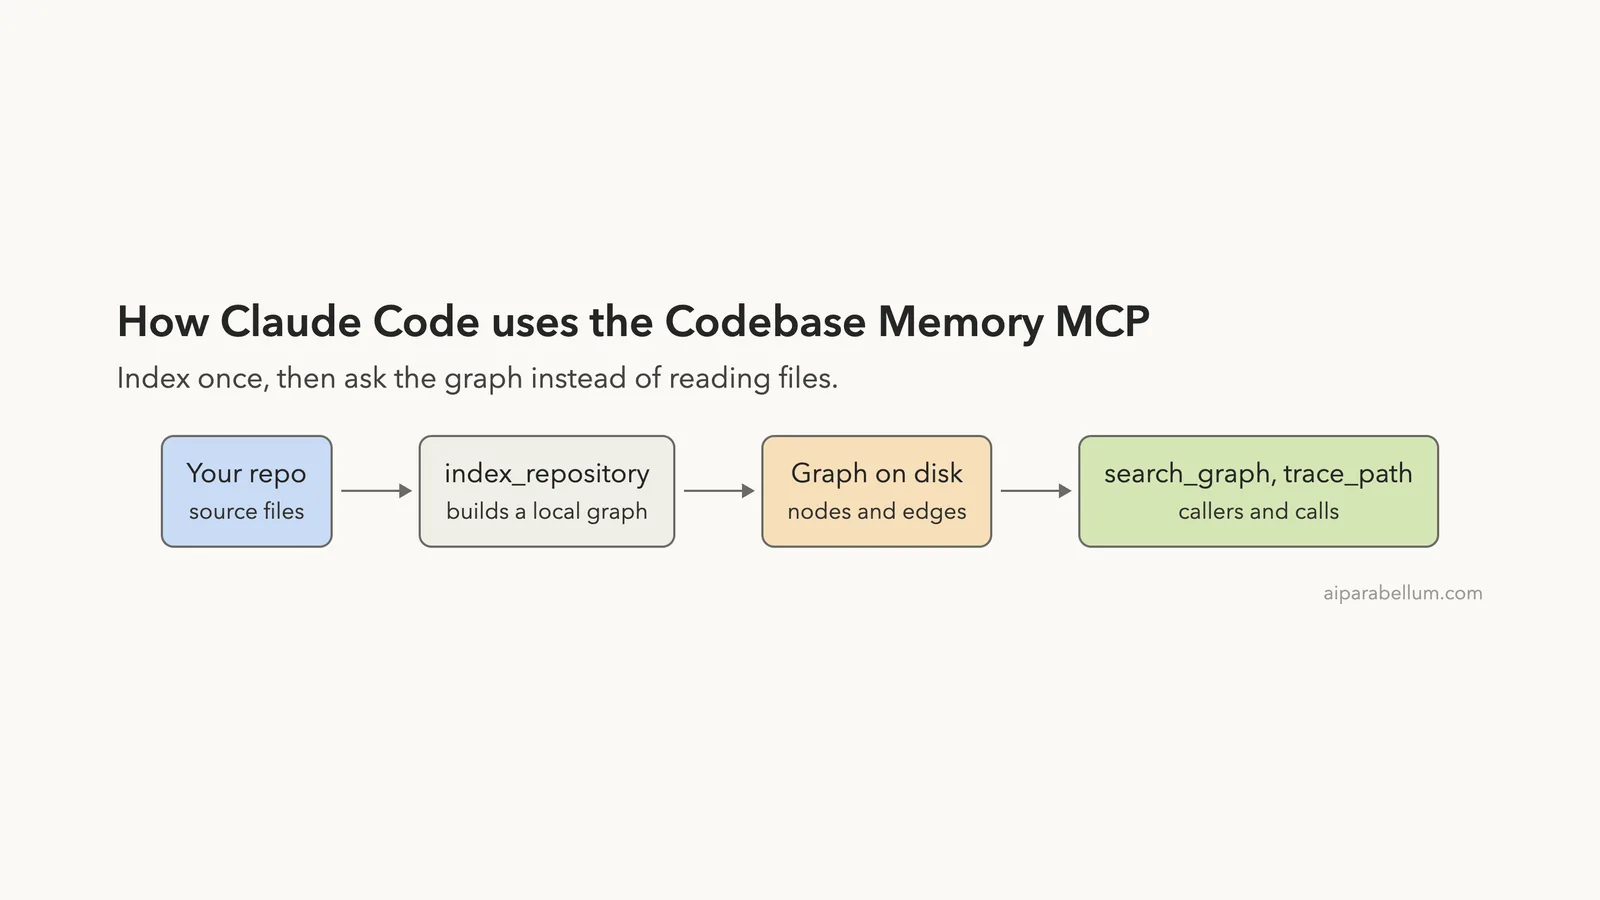
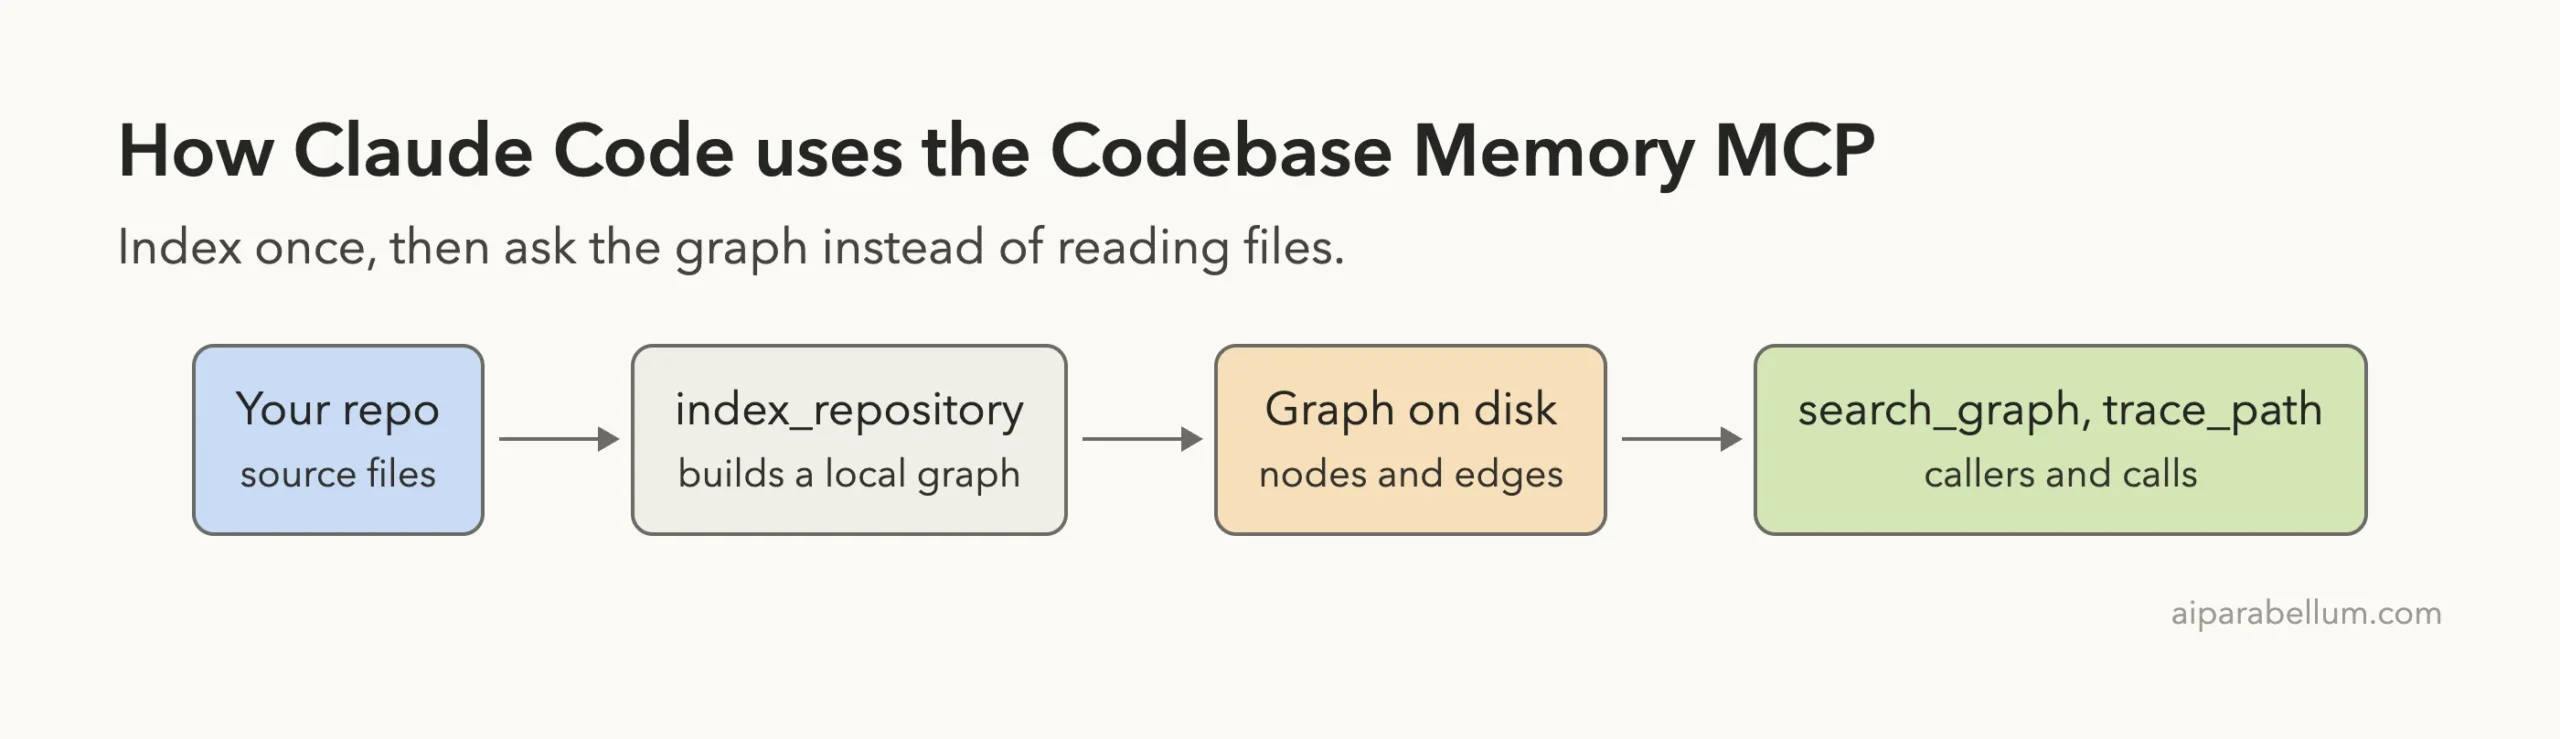
This server takes a different route. It parses your repo once and stores the result as a graph. Each function, class or file is a node, and each relationship, such as “this function calls that one”, is an edge.
Once the graph exists, Claude can ask for the callers of a function, or for what a function depends on, and get a short answer. MCP is the Model Context Protocol, the standard way to give Claude extra tools. If it is new to you, our MCP guide explains it.
The README describes it as local code intelligence with a persistent graph, and says indexing and graph queries need no hosted service or API key. It also lists an optional visual companion called CBM Lens, which is in beta. We did not use Lens in this test.
How to Add the Codebase Memory MCP to Claude Code
We worked in a throwaway demo folder, so your normal setup stays unchanged. Before running anything, we downloaded the npm package and read its install script. It fetches the native binary from the project’s GitHub releases and checks it against the release checksums.
The README also describes a codebase-memory-mcp install command that sets up many coding agents, with hooks and skills. We did not run it. That command writes agent configuration, and we wanted to keep the test to one MCP entry.
Instead, we installed the pinned package into a folder inside the demo and registered it at local scope. We also pointed the graph cache at the demo folder with the CBM_CACHE_DIR variable the README documents.
npm install --prefix tool [email protected]
claude mcp add cbm --scope local --env CBM_CACHE_DIR=/path/to/demo/cache -- /path/to/demo/tool/node_modules/.bin/codebase-memory-mcp
The part after -- is the command Claude Code runs to start the server. Put the server name first, because the --env flag takes more than one value and can swallow the name. The general steps are in the MCP quickstart, and scopes are explained in the MCP docs.
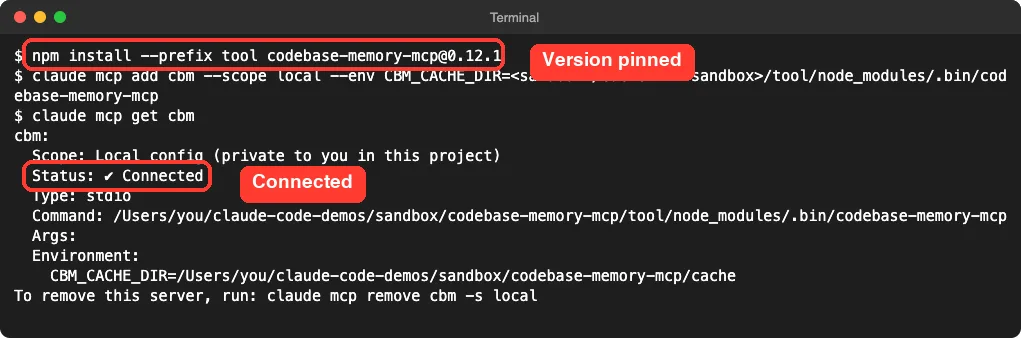
No sign-in prompt and no key. The claude mcp get cbm command shows the stored command, so you can double-check what will run.
The 17 Tools Claude Code Sees
We started claude in the demo folder and ran /mcp. The server showed as connected with 17 tools and some prompts.
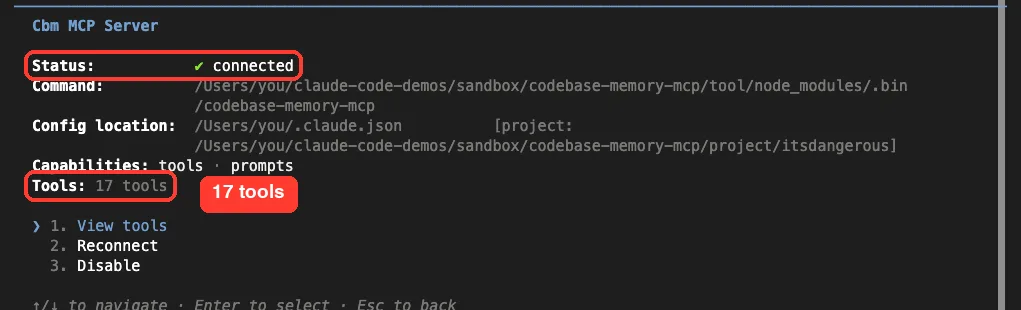
The tools list marks most tools as read-only. One stands out.
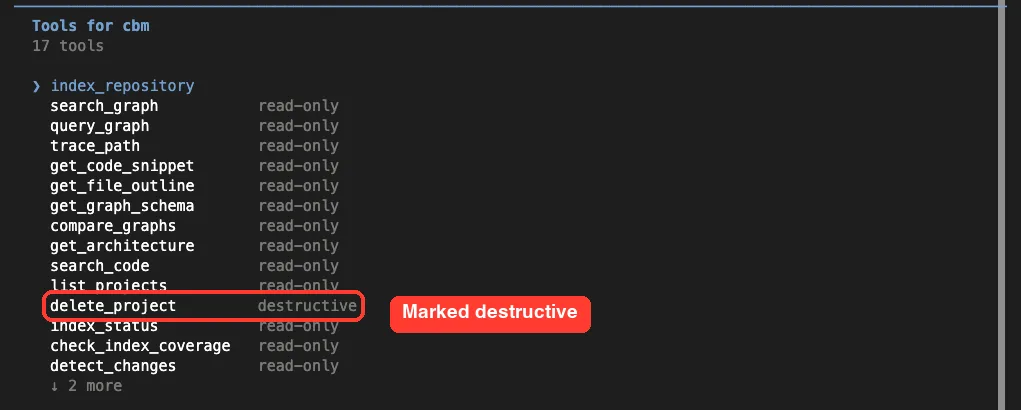
The delete_project tool is marked destructive, and index_repository has no label. We did not allow delete_project in any test. Here are the tools we used or looked at.
| Tool | What it does |
|---|---|
index_repository | Parses a folder and builds the graph |
search_graph | Finds symbols by name or pattern, with callers and callees |
trace_path | Follows calls from a symbol for a set number of hops |
get_architecture | Returns a compact overview of the project |
get_code_snippet | Returns the source for one symbol |
detect_changes | Shows which symbols a change could affect |
delete_project | Removes an index |
The other ten include query_graph, search_code, get_file_outline, compare_graphs, index_status and manage_adr. We did not run those.
Is the Codebase Memory MCP Safe to Add?
Ask what a server can do and where your data goes. The README says source analysis and graph storage run on your machine and that the project collects no telemetry. We did not test network traffic ourselves, so that is the README’s claim.
Two things are worth knowing. First, the native binary is downloaded when the package installs, so you are trusting the project’s releases. The script verifies checksums, and the README lists signing and scanning steps for its releases, but we did not check those.
Second, the full installer is much bigger than the MCP entry. It can write client configuration, skills, agent profiles and hooks for many tools, and the README says hooks are on by default. If you try it, read what it will change first, or do what we did and add only the MCP server.
The README also notes a background daemon that is shared between sessions and can stay running. After our sessions ended, we checked and found no server process still running.
We allowed only the tools we needed with --allowedTools. Claude Code would ask before using anything else.
What It Costs in Context
Every MCP server adds tool definitions to your session. We ran claude -p "/context" in the demo folder to see what this one added.
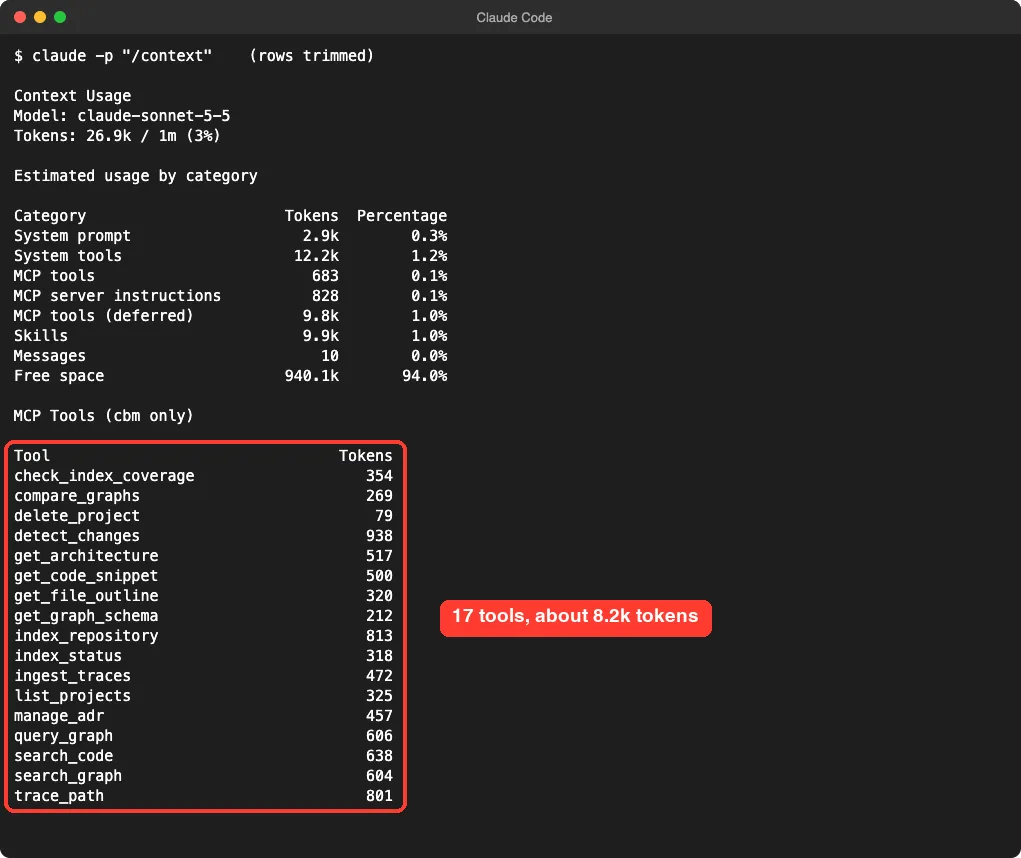
The 17 definitions added up to about 8.2k tokens when we summed the rows. The largest were detect_changes at 938, index_repository at 813 and trace_path at 801. Most of the tool tokens showed under the deferred line, which means Claude Code loads them only when needed.
The whole session showed 26.9k of 1m tokens used. Our context window guide explains what these numbers mean.
Test 1: Index a Real Project
For a project to index, we copied the public itsdangerous library, a small Python package for signing data, at commit 672971d. Its src folder has 1,176 lines of Python. Then we asked Claude to index it.
Use the cbm index_repository tool to index this project folder. Reply in 3 short lines: how many nodes and edges, and how long it took.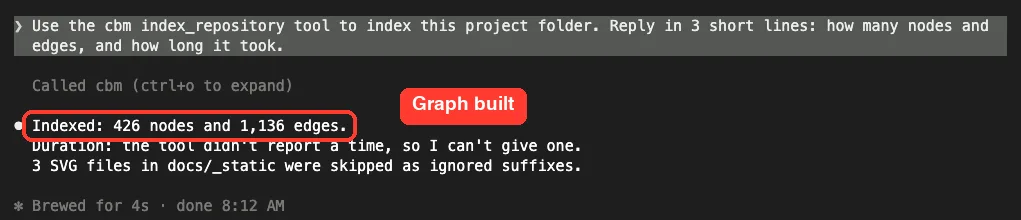
The graph came back with 426 nodes and 1,136 edges. Claude said the tool did not report a time, and the whole turn took about four seconds. It also noted that three SVG files in the docs were skipped.
Test 2: Who Calls This Function?
Now the real question. A function called want_bytes converts text to bytes and is used all over the library. We asked for every caller.
Use the cbm graph tools to find every function or method that calls want_bytes, with file names. Answer in a short list.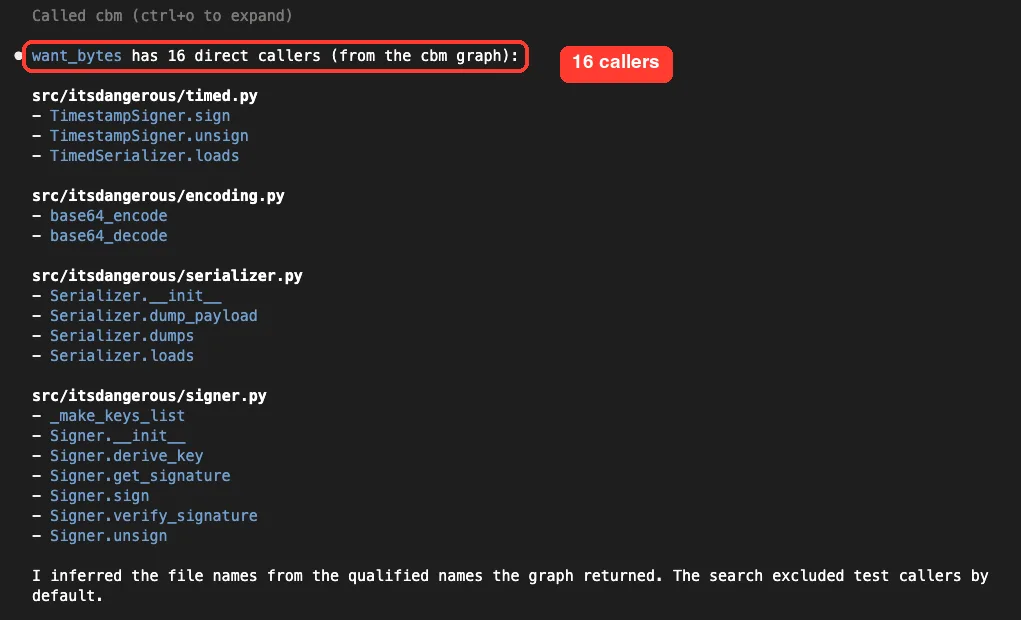
Claude listed 16 callers: 3 in timed.py, 2 in encoding.py, 4 in serializer.py and 7 in signer.py. It also said it inferred file names from the qualified names and that the search excluded test callers by default.
We then checked by hand. A grep for want_bytes( in src found 19 call lines. Matching each to its enclosing function gave the same 16 functions.
A few functions call it more than once, which explains the gap. So the graph was right here.
Test 3: What Does a Function Depend On?
Next we asked for a trace, which is the kind of question a graph is built for.
Use cbm trace_path to show what Signer.sign depends on, two hops deep. Answer in 5 short lines.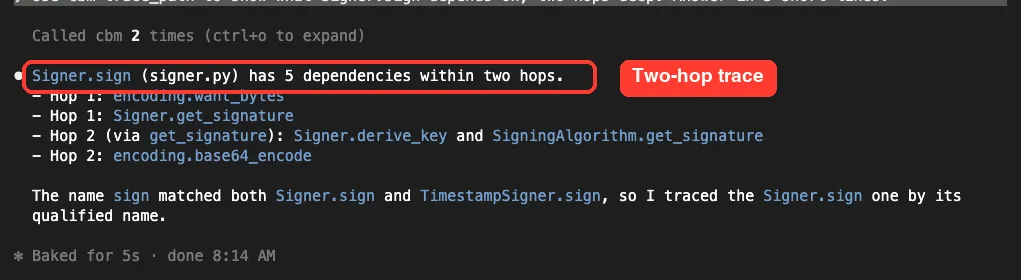
The answer listed five dependencies. At hop one were want_bytes and Signer.get_signature. At hop two were Signer.derive_key, SigningAlgorithm.get_signature and base64_encode.
Claude also noticed that the name sign matched two methods, so it traced the one with the qualified name. That is a useful habit to ask for, since short names are often ambiguous.
Did the Graph Save Tokens?
The README says focused graph queries can reduce repeated file reads and token use. It cites a 31-repository preprint that reports 10 times lower token use, measured in March 2026 on that study’s workloads. We wanted to see it on our small project.
We ran the same question twice with claude -p and JSON output: once with the graph tools allowed, once with the MCP servers turned off and only Read, Grep and Glob allowed.
Find every function or method in src that calls want_bytes. List them as Class.method with file. Be brief.| Run | Turns | Total input tokens | Answer |
|---|---|---|---|
| With the graph | 4 | 171,090 | 16 callers |
| Without the graph | 3 | 126,562 | The same 16 callers |
Both runs found the same 16 functions. The graph run used more turns and more input tokens. The totals include cached input, which is a large share of every run, so read them as rough.
This does not disprove the README. Our project has under 1,200 lines, so a plain search already finds everything in one or two steps. The graph’s advantage should show on a large codebase where a search returns hundreds of matches, but we did not test one, so we cannot say how big the gain is.
What We Could Not Test
- We did not test a large repo, so we have no data on speed or token savings at scale.
- We did not run the full
installcommand, hooks, skills or agent profiles. - We did not use CBM Lens, the semantic search, the Smart CI feature or the infrastructure tracing.
- We tested only Python code. The README lists many more languages.
Who Should Add the Codebase Memory MCP to Claude Code?
| Your situation | Our advice |
|---|---|
| You work in a large or unfamiliar codebase | Try it. Callers and dependency traces are what it is built for |
| You work in a small project | Probably skip it. Claude Code already finds the same answers with a search |
| You want a visual map of your code | Look at CBM Lens, which we did not test |
| You worry about config changes | Add only the MCP server and skip the full installer |
Common Mistakes
- Adding the server at user scope for a quick test. Use
--scope localto keep it in one folder. - Leaving the version unpinned, so a newer release can change what runs.
- Running the full installer without reading what it writes to your agent configuration.
- Forgetting to index first. The graph tools have nothing to search until
index_repositoryhas run. - Assuming big token savings on a small repo. We saw none.
Pro Tips
- Run
/mcpto confirm the server is connected and to spot the destructive tool. - Allow only the tools you need with
--allowedTools. - Ask for qualified names, such as
Signer.sign, so ambiguous names do not mix results. - Verify a caller list once with
grepon your own code, so you know how far to trust it. - Keep the cache folder somewhere you can delete, using
CBM_CACHE_DIR.
Try It Yourself
Run this in a throwaway folder that holds a small project you trust. Remove the server when you are done.
npm install --prefix tool [email protected]
claude mcp add cbm --scope local --env CBM_CACHE_DIR=$PWD/cache -- $PWD/tool/node_modules/.bin/codebase-memory-mcp
claude
# inside Claude Code:
Use the cbm index_repository tool to index this folder. Then find every function that calls my_helper and show what my_main_function depends on, two hops deep.
# when finished:
claude mcp remove cbm -s local
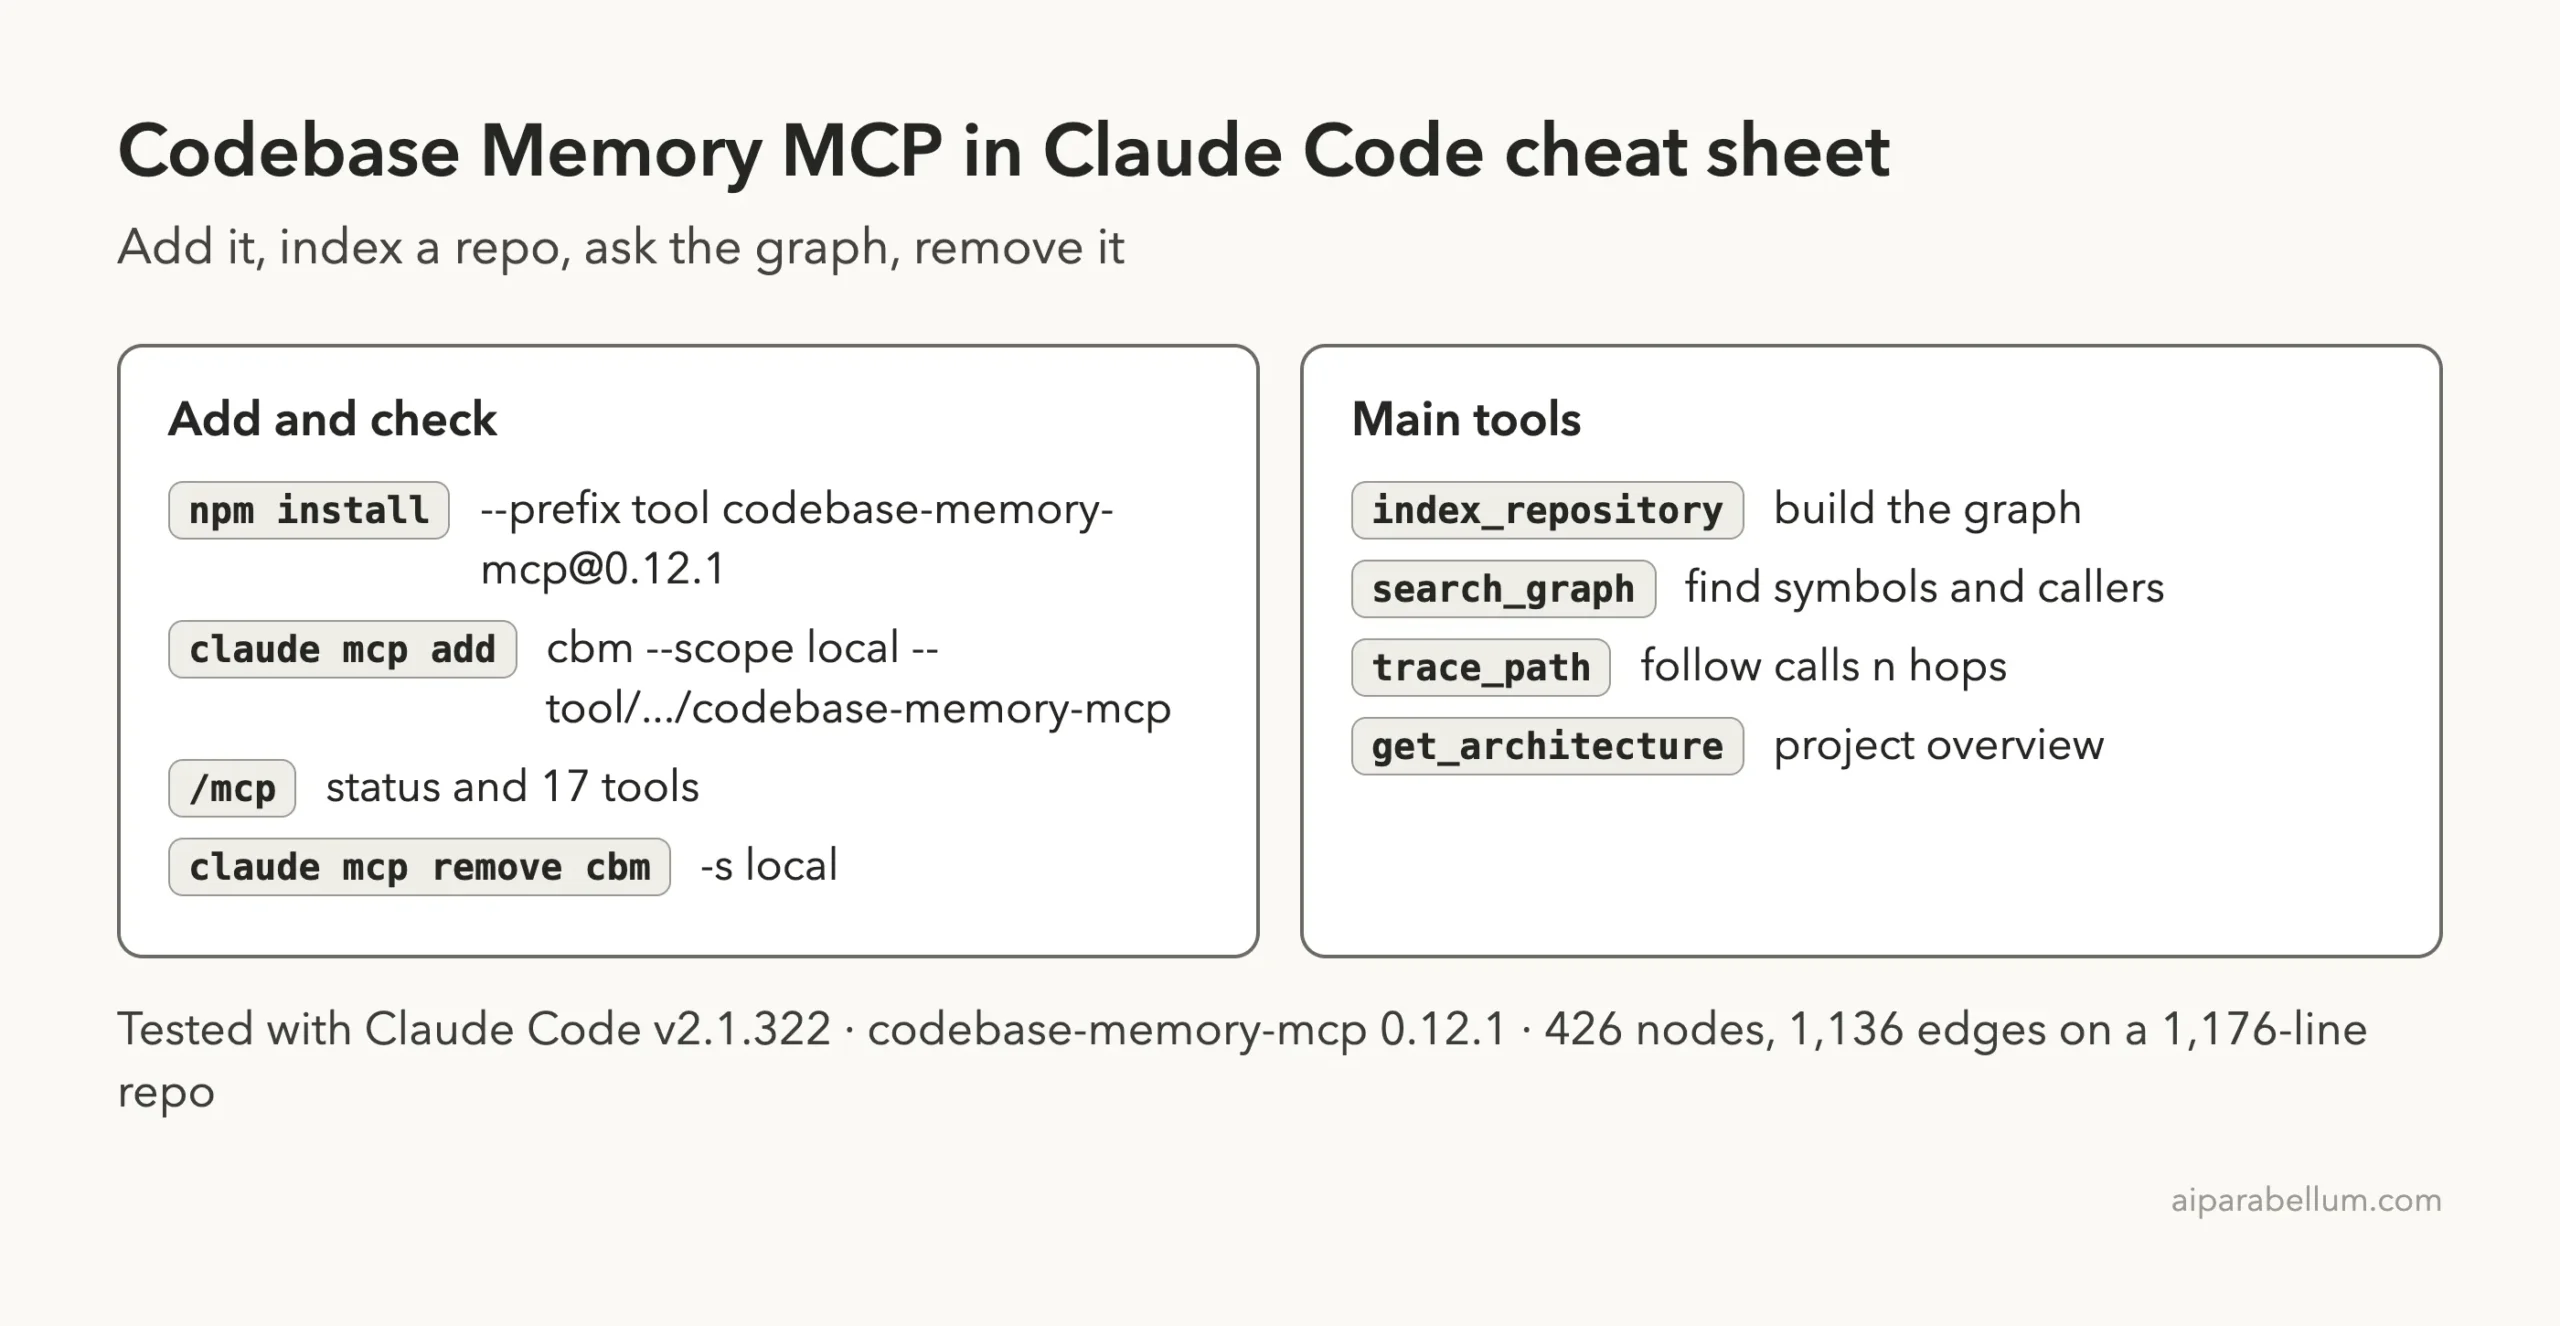
Cheat Sheet
Frequently Asked Questions
Does the Codebase Memory MCP need an account or API key?
No. The README says indexing and queries need no hosted service or key, and we entered none.
How much context does it use?
The 17 tool definitions added up to about 8.2k tokens in our /context output, and most were deferred until needed.
Is the graph accurate?
On our test it matched a manual grep check: 16 of 16 callers. We tested one function in one small Python project.
Does it save tokens?
Not on our small repo, where the plain search used fewer input tokens. The README reports large savings on bigger workloads, which we did not test.
How do I remove it?
Run claude mcp remove cbm -s local from the folder where you added it, then delete the cache folder you set with CBM_CACHE_DIR.
Conclusion
The Codebase Memory MCP is easy to add, needs no account, and costs about 8.2k tokens of tool definitions. In our run, it indexed a small project into 426 nodes and 1,136 edges, listed all 16 callers of a helper correctly, and traced a function’s dependencies two hops deep. The trade-off is that on a project this small a plain search did the same job with fewer tokens, so the value is likely in larger codebases that we did not test. If you work in one, try it on a repo you know well and check a few answers yourself.
Next, browse more tested add-ons in our skills directory, or read our Claude overview.