If you are looking for a Claude Code Datadog plugin, you will find it in the official marketplace next to fifteen close cousins from Grafana, New Relic, Dynatrace, Honeycomb, PostHog, Amplitude, Pendo and others. This guide explains what each one does, which parts we ran on a Mac, and which parts need your own vendor account.
This guide is part of our Claude Code tutorials. Find more add-ons in our Skills Directory.
Tested with Claude Code v2.1.318 on 2026-11-07 (macOS).
We read the hooks and connection files of every plugin first. Then we loaded thirteen of them into a throwaway sandbox, which added 303 skills, and asked three of those skills real questions about a tiny demo project. We never signed in to any vendor and never typed a key, so anything about live dashboards, traces or user data comes from each plugin’s own files and README.
Quick Summary: Monitoring and Analytics Plugins at a Glance
These plugins connect Claude to a company that already watches your production app or your users. The plugin is only a bundle of skills plus a connection address, so it does nothing useful until you sign in to that company.
| Plugin | Maker | What it does | Account needed? | Install command |
|---|---|---|---|---|
| datadog | Datadog | Query logs, metrics, traces and dashboards in plain language (preview) | Yes, API and application keys | /plugin install datadog@claude-plugins-official |
| grafana-cloud-mcp | Grafana | Hosted connection to Grafana Cloud, no local install | Yes, Grafana Cloud sign-in | /plugin install grafana-cloud-mcp@claude-plugins-official |
| grafana-mcp | Grafana | Dashboards, data sources, alerts and incidents on self-hosted Grafana | Yes, a service account token and Docker | /plugin install grafana-mcp@claude-plugins-official |
| grafana-assistant | Grafana | One skill for the Grafana Assistant command line tool | Yes, plus the separate CLI | /plugin install grafana-assistant@claude-plugins-official |
| newrelic | New Relic | APM, Kubernetes, cloud cost and NRQL investigations | Yes, OAuth sign-in | /plugin install newrelic@claude-plugins-official |
| dynatrace | Dynatrace | 38 skills for DQL queries, problems, logs and setup | Yes, environment URL and platform token | /plugin install dynatrace@claude-plugins-official |
| honeycomb | Honeycomb | Query patterns, SLOs, production investigations, OpenTelemetry help | Yes, sign-in for the MCP server | /plugin install honeycomb@claude-plugins-official |
| dash0 | Dash0 | Sends your Claude Code sessions out as OpenTelemetry traces | Yes, or any OpenTelemetry backend | /plugin install dash0@claude-plugins-official |
| logfire | Pydantic | Add Logfire tracing to Python apps and query it | Yes, Logfire sign-in | /plugin install logfire@claude-plugins-official |
| posthog | PostHog | Analytics, feature flags, experiments and error tracking | Yes, OAuth sign-in | /plugin install posthog@claude-plugins-official |
| amplitude | Amplitude | Charts, dashboards, experiments and instrumentation help | Yes, sign-in | /plugin install amplitude@claude-plugins-official |
| pendo-analytics | Pendo | Account health, feature adoption, session replay triage | Yes, a Pendo subscription | /plugin install pendo-analytics@claude-plugins-official |
| pendo-guides | Pendo | Build in-app guides as HTML, CSS and JavaScript | Not per its description | /plugin install pendo-guides@claude-plugins-official |
| pendo-orchestrate | Pendo | Draft email journeys through the Pendo connector | Yes | /plugin install pendo-orchestrate@claude-plugins-official |
| setup-agent-analytics | Pendo | Instrument an AI agent with the right Pendo SDK path | Yes, a Pendo API key at run time | /plugin install setup-agent-analytics@claude-plugins-official |
| setup-mcp-agent-analytics | Pendo | Instrument an MCP server so tool calls reach Pendo | Yes | /plugin install setup-mcp-agent-analytics@claude-plugins-official |
What Is a Claude Code Datadog Plugin and Its Monitoring Cousins?
A monitoring tool such as Datadog collects logs, metrics and traces from your live app. A product analytics tool such as PostHog or Amplitude records what people click and which features they use. A plugin lets Claude Code read from those systems while you fix a bug or plan a feature.
Under the hood, a plugin can hold skills, commands, agents, hooks and an MCP server. The MCP server is the connection to the vendor, and the skills are written instructions on how to use it well. Our guide to MCP guide explains that connection layer in detail.
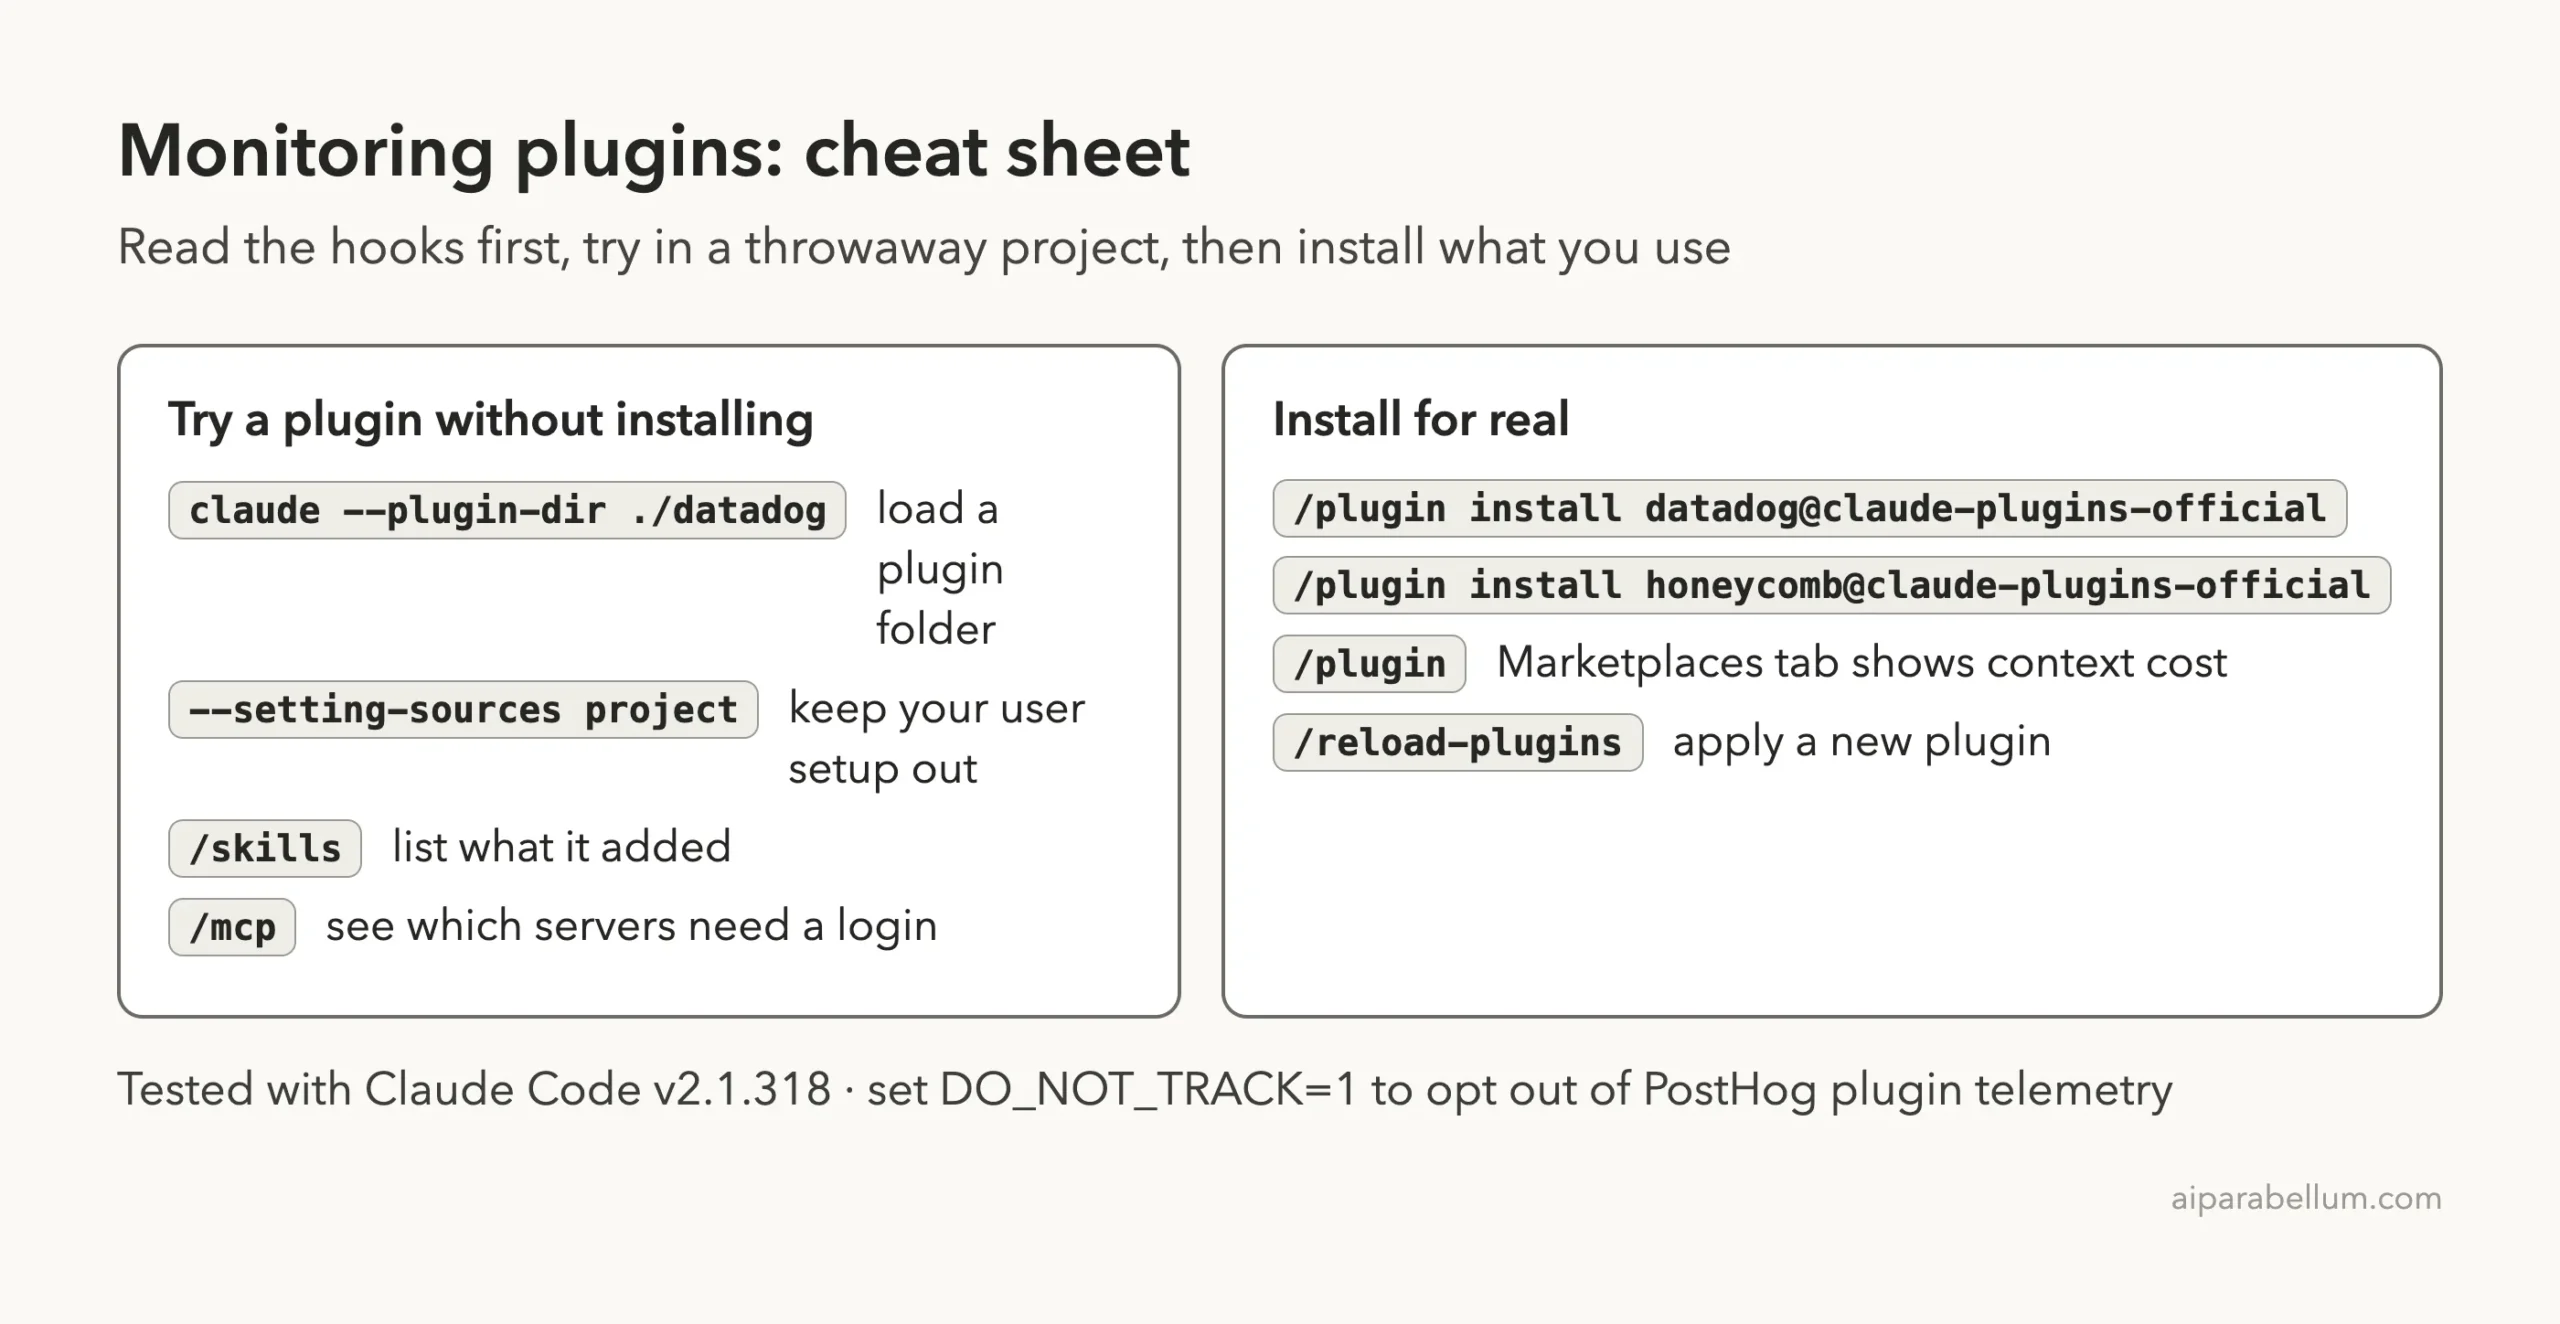
Anthropic’s docs on discovering plugins add one cost to keep in mind. Every skill’s name and description sits in Claude’s context on every turn, and the Marketplaces tab in /plugin shows an estimate before you install.
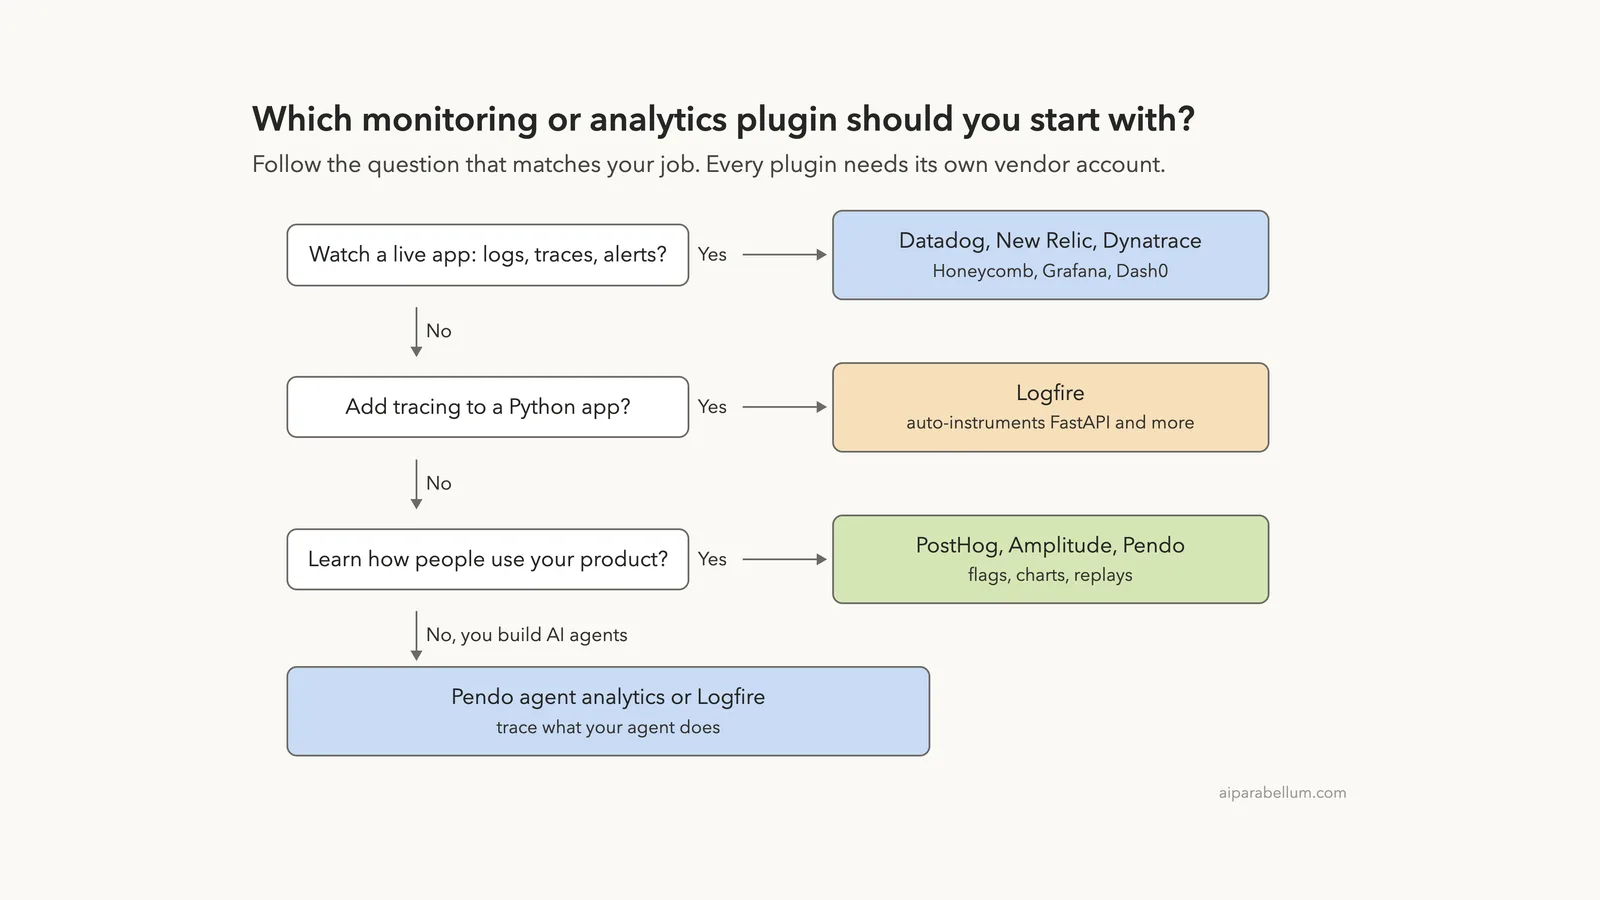
Which Plugin Fits Which Job?
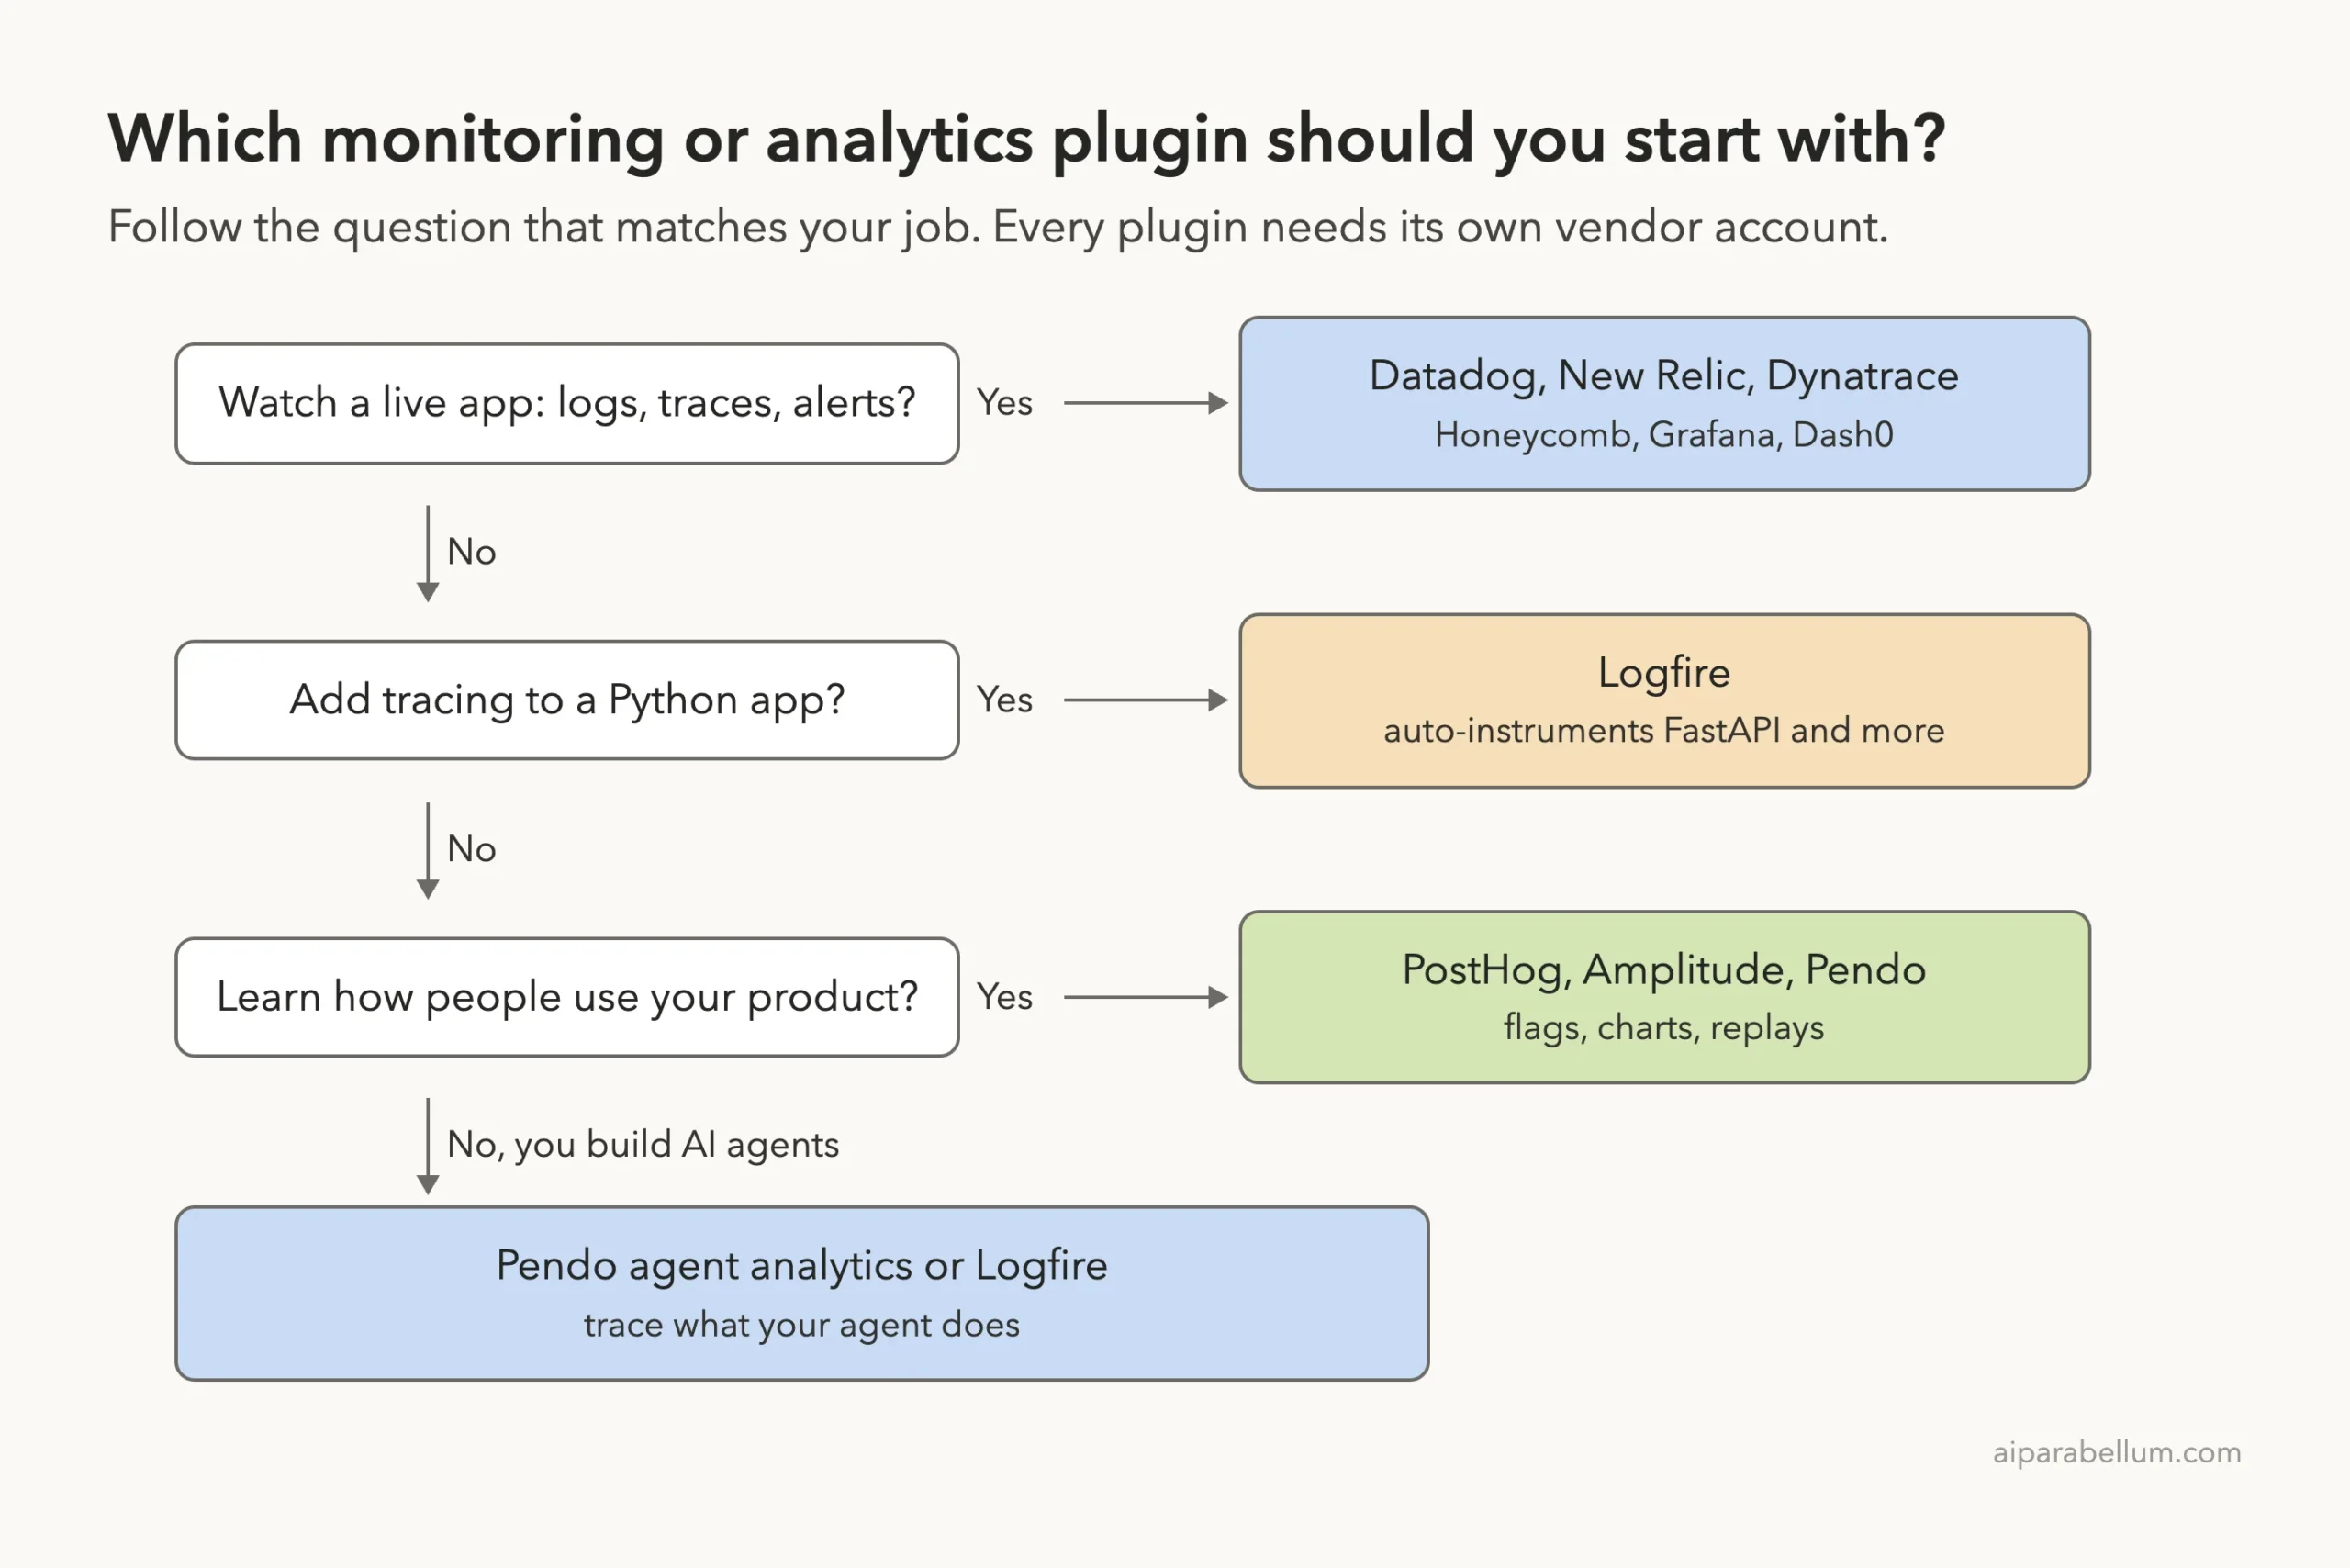
Start from the job you need done, not from the logo. If your company already pays for one of these services, use that one and skip the rest.
How We Tested Without Touching Our Setup
We cloned each plugin’s repository into a sandbox and copied the plugin folders into an empty demo project. Then we started Claude Code with one --plugin-dir flag per plugin plus --setting-sources project, so nothing from our own Claude setup mixed in. We never ran /plugin install, and we kept Claude in plan mode so it could read files but not change them.
The demo project has two small files. app.py is a tiny Flask web app with one order route and a pretend slow database call. agent.py is a ten-line script that asks Claude a question through the Anthropic Python library.
We also set DO_NOT_TRACK=1 before starting, because one plugin sends anonymous usage telemetry by default. More on that below.
Installing takes seconds, but every plugin here is idle until you finish the vendor login.
What We Read Before Running Anything
These plugins can run commands on your computer, so we read every hook and connection file first. Here is what we found, plugin by plugin.
- Datadog: one hook that runs after the chart tools and sends the result to a local side panel on macOS. The connection address is built from your own
DD_MCP_DOMAINsetting, and your keys travel in headers. - Grafana Cloud: no hooks, one hosted connection at
mcp.grafana.com. - Grafana self-hosted: no hooks, but the connection starts
docker runfor thegrafana/mcp-grafanaimage. We did not load it, because we did not want a container to start on our test machine. - New Relic: no hooks, four skills, one hosted connection at
mcp.newrelic.com. - Dynatrace: no hooks. The connection reads
DT_ENVIRONMENTandDT_PLATFORM_TOKENand sends the token as a bearer header. - Honeycomb: two hooks that only run around Honeycomb query tools. They keep a per-session cache of column names and check a query against it before it goes out.
- Logfire: no hooks in the main plugin, 10 skills and 7 commands, and a connection that defaults to Pydantic’s US server. A second plugin in the same repository has hooks, but we did not use it.
- Amplitude: no hooks, 36 skills, one hosted connection.
- Pendo: no hooks in the five plugins we loaded. Two connections appear in the analytics plugin.
- PostHog: hooks that run at session end, after a skill is used and before certain write commands. We cover them in the next section.
- Dash0: hooks on nearly every Claude Code event, driven by a script that can download a program. We did not load it.
Two Plugins You Should Read Twice
Dash0 is built to watch Claude Code itself. Its hook script runs on session start, prompts, tool calls and more. Its own comments say it fetches a release binary from GitHub and checks a checksum before running it, and that a failed check installs nothing.
That design may be exactly what you want if you collect OpenTelemetry data from coding sessions. We chose not to run a downloaded program in a test sandbox, so we cannot say how well it works. We only read the script.
PostHog’s plugin has a different surprise. Its skill-usage hook sends one anonymous event to a PostHog project whenever you use one of its skills, and it is on by default. The script’s header lists the ways to turn it off, including DO_NOT_TRACK=1 and DISABLE_TELEMETRY=1.
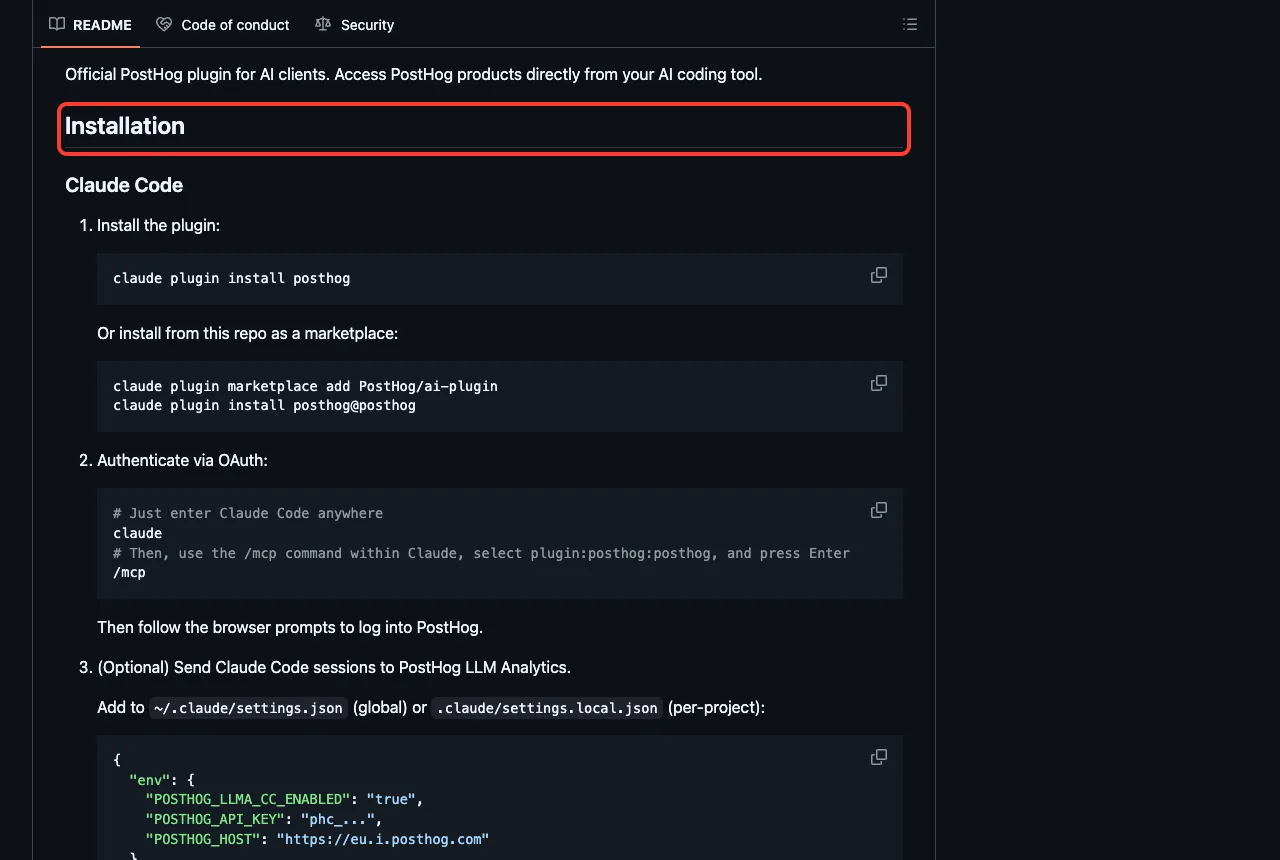
The session-end hook that sends your Claude Code sessions to PostHog LLM Analytics is off unless you set POSTHOG_LLMA_CC_ENABLED and an API key. A third hook asks for your permission before write commands to the PostHog connection. In our run, we opted out first.
What We Ran and What Comes From the Docs
| Item | Status |
|---|---|
| Loading 13 plugins and listing 303 skills | We ran it |
| Seeing which connections need a login or setup | We ran it |
| Honeycomb OpenTelemetry skill on a demo Flask app | We ran it, without Honeycomb data |
| Pendo agent analytics skill on a demo agent file | We ran it, without Pendo data |
| Dynatrace DQL skill without an environment | We ran it, and it explained the missing setting |
| Dash0 and Grafana self-hosted plugins | Read only, not loaded |
| Real dashboards, traces, flags, charts and replays | From each plugin’s README and files, not tested |
Loading Thirteen Plugins in One Session
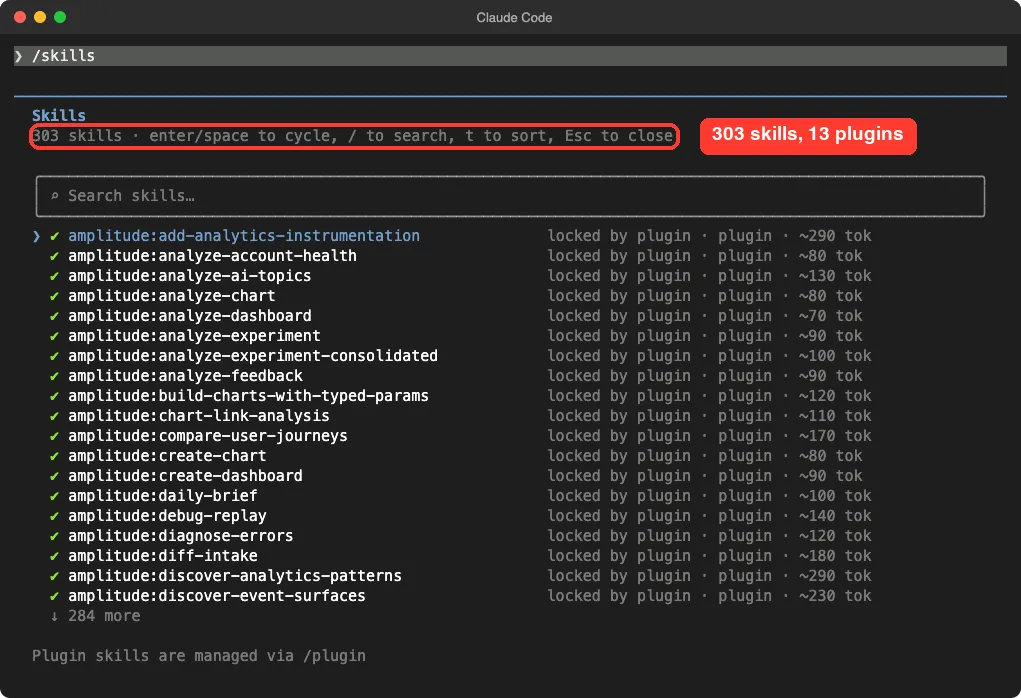
The /skills screen lists 303 skills, each marked as locked by its plugin, with a rough size such as 80 or 290 tokens. PostHog alone contributes 185 of them, which is a good reason to install only the plugins you use.
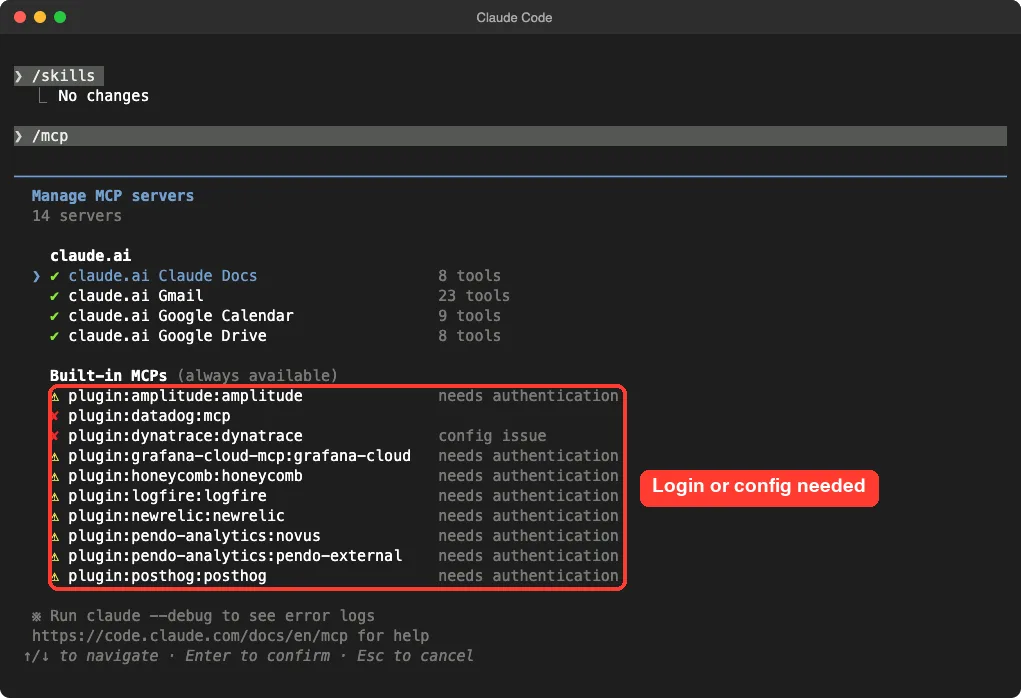
The /mcp screen matters more. Eight connections showed “needs authentication”, the Dynatrace connection showed a config issue, and Datadog showed a red failure mark. The Datadog failure is expected, because we had not set a domain or keys.
Claude Code Datadog Plugin, New Relic and Dynatrace: Ask Your Live App
These three are the classic monitoring vendors. Their plugins let you ask questions such as “show error logs for the checkout service from the last hour” and let Claude run the lookups for you.
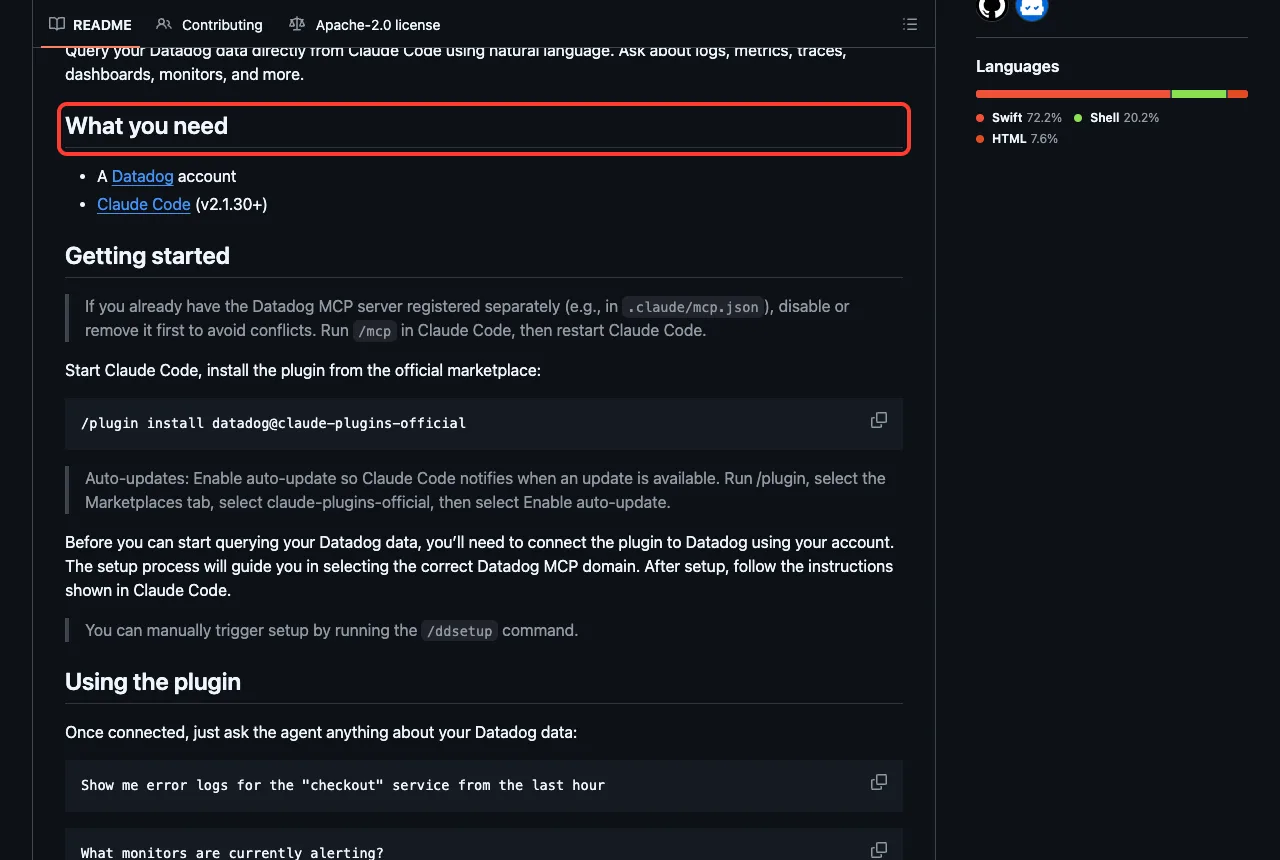
Datadog’s README says the plugin is in preview, needs a Datadog account and Claude Code v2.1.30 or newer. After install, a /ddsetup command guides you through choosing the right Datadog domain. The plugin has six skills, including datadog-app, ddsetup, ddtoolsets and ddviz.
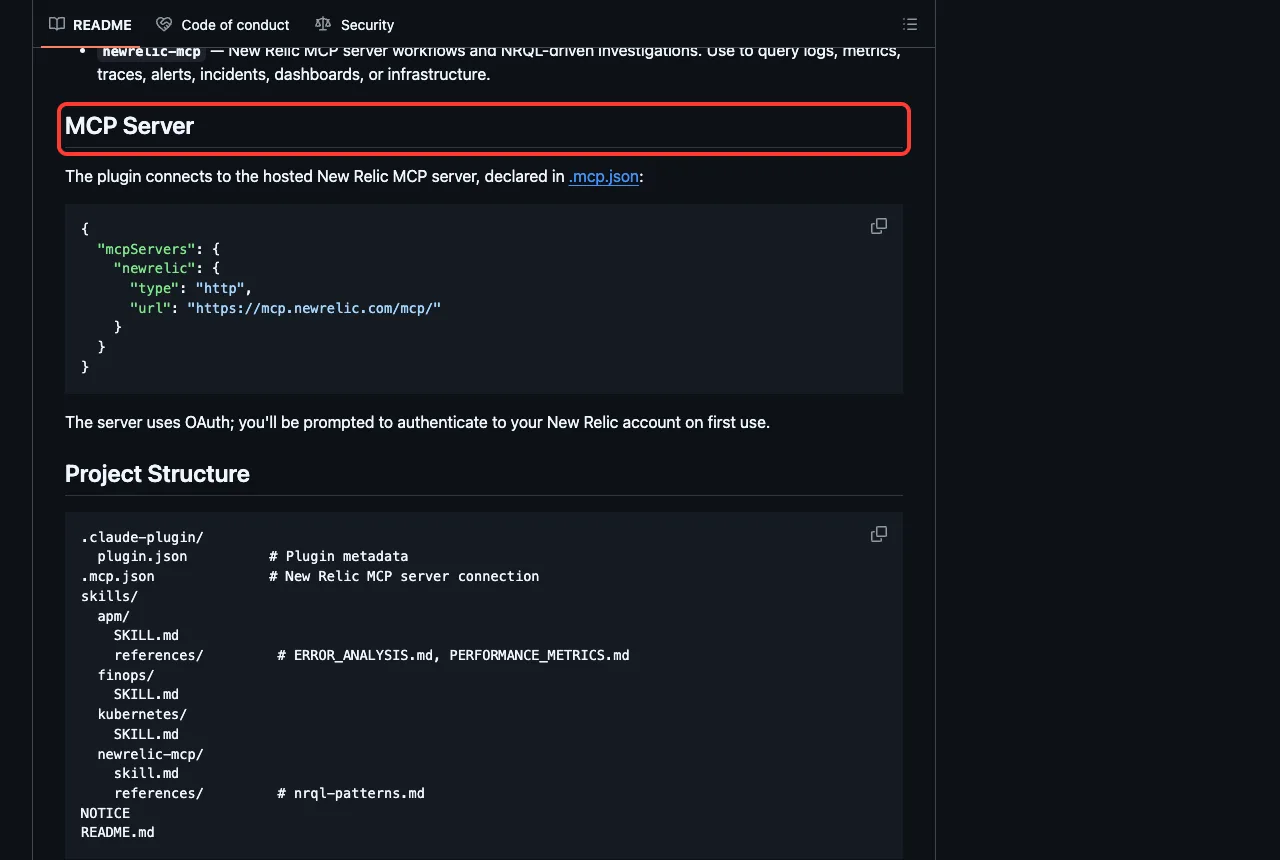
New Relic’s plugin has four skills: apm, finops, kubernetes and newrelic-mcp. Its README notes that the cost skill needs cloud cost data already in New Relic, and the Kubernetes skill needs data from nri-kubernetes.
Dynatrace ships the biggest monitoring plugin, with 38 skills covering DQL queries, problems, logs, Kubernetes, mobile setup and more. Its README tells you to set DT_ENVIRONMENT and DT_PLATFORM_TOKEN before starting Claude Code.
We asked the dt-dql-essentials skill what it can do without an environment. Claude loaded the skill and said the Dynatrace server failed with “Missing environment variables: DT_ENVIRONMENT”. It listed what it could still do, such as fixing common query mistakes, and what it could not, such as checking real field names.
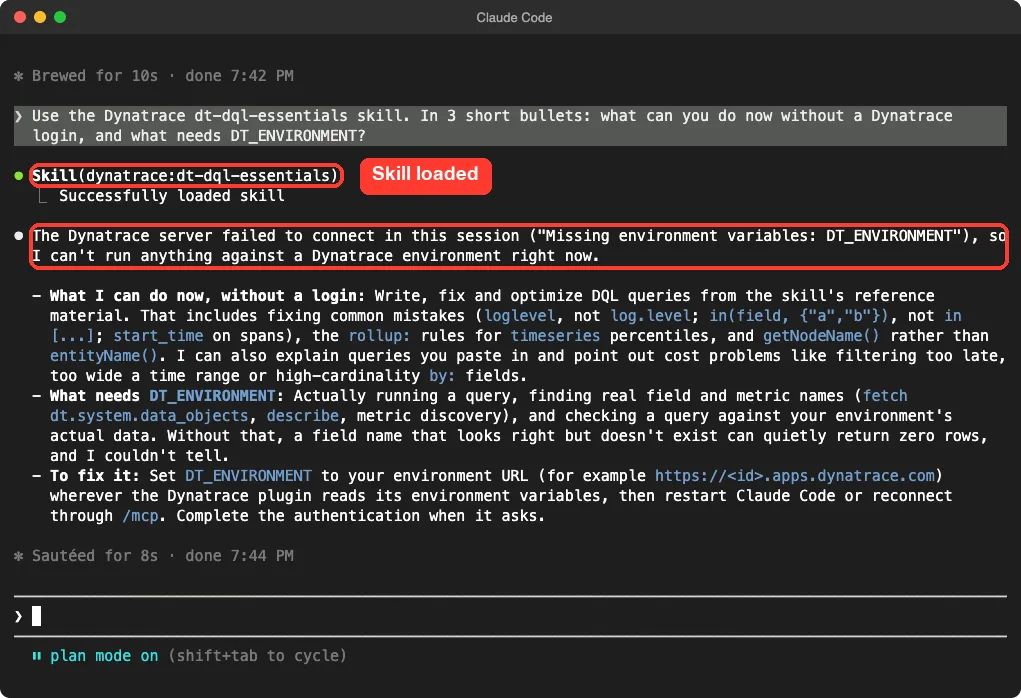
This is one demo, and we never connected to Dynatrace. What we can say is that the skill did not invent data it could not reach.
Honeycomb, Logfire and Grafana: Tracing and Dashboards
This group is about traces and dashboards, and two of the plugins help you add tracing to code you write.
Honeycomb
Honeycomb’s plugin has 11 skills, two agents and a /honeycomb-setup command. Its README text still says nine skills, so we trust the folder and the /skills screen over the README count. Skills include query-patterns, production-investigation, slos-and-triggers and otel-instrumentation.
We asked the OpenTelemetry skill what it would add to our demo Flask app. Claude answered in three parts: wrap the app with the Flask instrumentor, record the order ID and the database wait on a span, and mark the unknown-order crash as an error. It also said we need a Honeycomb ingest key sent as a header, and warned that Honeycomb rejects data silently without it.
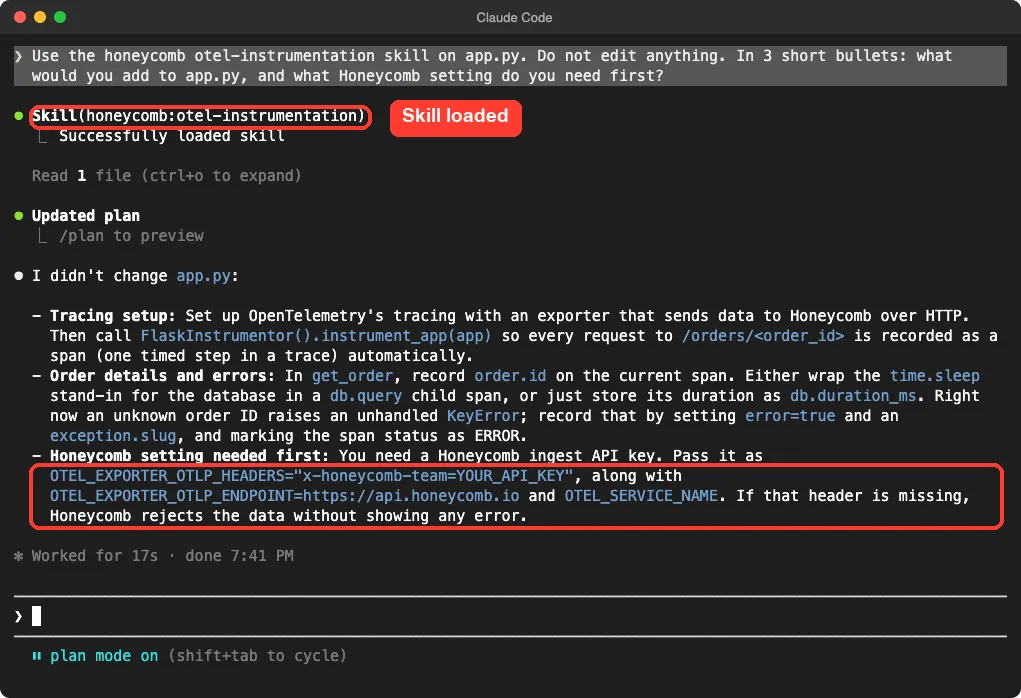
Claude changed nothing, because we were in plan mode. We did not run the proposed setup or send any data to Honeycomb.
Logfire
Pydantic’s Logfire plugin is aimed at Python apps. Its commands include /logfire:connect, /logfire:status, /instrument, /debug and /query, and its README says it can auto-instrument libraries such as FastAPI, httpx and SQLAlchemy.
We loaded it and saw its connection wait for a login, but we did not run its commands. You can read the source in the Pydantic skills repository.
Grafana
Grafana has three entries, and they are not equal. The Grafana Cloud plugin is a hosted connection with one skill, and we loaded it. The self-hosted plugin runs a Docker container and has one skill, and we only read it.
The third entry, grafana-assistant, deserves a warning.
The marketplace still lists it, but Grafana’s repository removed the plugin on 2026-10-27 with a commit titled as dropping grafana-assistant. The marketplace points at an older saved version that has one skill for the grafana-assistant command line tool, which you must install yourself. Check that it still installs before you plan around it.
PostHog, Amplitude and Pendo: Learn From Your Users
These plugins answer “what did people actually do”. They bring analytics, experiments and replays into the chat.
PostHog and Amplitude
PostHog’s plugin has 185 skills, 6 commands and one agent. Its README says to authenticate with OAuth through /mcp. Its marketplace description lists analytics, feature flags, experiments, error tracking and insights.
Amplitude’s plugin has 36 skills, with names such as analyze-chart, create-dashboard, analyze-experiment, debug-replay and add-analytics-instrumentation. Its repository, the Amplitude MCP marketplace, says it also works with Cursor. We loaded both and confirmed both connections wait for a sign-in.
Pendo
Pendo has five plugins from one repository, the Pendo plugin repository. The analytics one covers app health, account health, feature adoption, feedback analysis and replay triage. The guides plugin writes in-app guides, and the orchestrate plugin drafts email journeys that stay as drafts until you activate them in Pendo.
We tested the agent analytics skill on our demo agent.py. Claude picked the Python SDK path, since the file calls Anthropic directly. It said to initialize once with an API key from an environment variable, add a tracing decorator to the answer function, and set a visitor and conversation ID for each request.
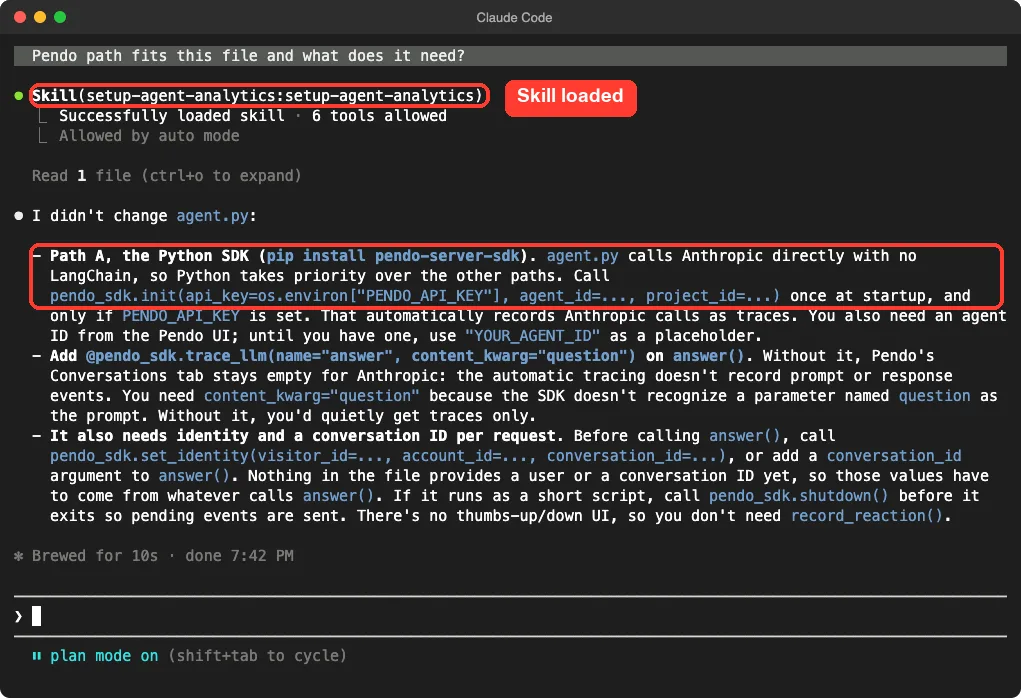
Again, we did not install the SDK or send anything to Pendo. We only checked that the skill reads the file and explains a sensible plan.
Safety Notes Before You Install
These plugins connect Claude to systems with real company and customer data. A few habits help.
- Install from the official marketplace and read the plugin details before you confirm.
- Use the smallest key or role the vendor offers, ideally read-only.
- Keep keys in environment variables, never in files that go into git.
- Try a new plugin in plan mode first, as we did.
- Check hooks. Anthropic’s plugin documentation says a plugin runs with your permissions.
Try It Yourself
Make an empty folder with a tiny Flask file, and load only the Honeycomb plugin from a cloned folder. Adjust the path to where you cloned it.
git clone https://github.com/honeycombio/agent-skill honeycomb-plugin
claude --permission-mode plan --setting-sources project --plugin-dir ./honeycomb-plugin/honeycomb
Then paste this prompt and compare the answer with the Honeycomb screenshot above.
Use the honeycomb otel-instrumentation skill on app.py. Do not edit anything.
In 3 short bullets: what would you add to app.py, and what Honeycomb
setting do you need first?
Common Mistakes
- Installing a plugin and expecting data. Without the vendor login, it only holds instructions.
- Installing everything. PostHog alone adds 185 skill names to Claude’s context.
- Forgetting to restart after setting an environment variable such as
DT_ENVIRONMENT. - Skipping the hooks. Telemetry and downloads are easy to miss unless you read the script headers.
- Using a powerful admin key when a read-only key would do.
Pro Tips
- Run
/mcpafter installing, because it shows which connections still need a login. - Open a plugin from the Marketplaces tab in
/pluginto see its context cost first. Our plugin install guide covers scopes and updates. - Pair monitoring with error tracking. Our guide to error tracking plugins covers Sentry and PagerDuty.
- Pick one monitoring plugin and one analytics plugin at most, and keep the rest uninstalled.
Cheat Sheet
Frequently Asked Questions
Is there an official Claude Code Datadog plugin?
Yes. The official marketplace lists datadog, and Datadog’s README gives /plugin install datadog@claude-plugins-official. It is marked as a preview, and it needs a Datadog account.
Do these plugins work without paying?
Each plugin needs an account with its vendor. We did not check which plans include API or MCP access, so look at each vendor’s pricing page first.
Does the PostHog plugin send data about me?
Its script header says it sends one anonymous event when you use one of its own skills, unless you opt out. Setting DO_NOT_TRACK=1 is one of the listed opt-outs. Sending your full sessions to PostHog needs extra settings that are off by default.
Can I use these plugins on Windows or Linux?
We tested on macOS. The Windows and Linux steps follow Anthropic’s official instructions, and the plugins are mostly plain files plus a web connection. The Datadog chart panel is described as macOS only.
Why did we skip Dash0 and Grafana self-hosted?
Dash0 downloads and runs a helper program from its hooks, and Grafana self-hosted starts a Docker container. We read both but did not run them on a test machine, so we cannot vouch for how they behave.
Conclusion
The Claude Code Datadog plugin and its fifteen neighbors bring monitoring, tracing and product analytics into your terminal, but every one needs your own vendor login. We loaded 303 skills from thirteen plugins, watched every connection ask for a login or a setting, and saw the Honeycomb, Pendo and Dynatrace skills explain honestly what they could not reach. Pick one monitoring plugin and one analytics plugin, read their hooks first, try them in plan mode, and find more add-ons in our Claude guide and the Skills Directory.