Long Claude Code sessions get slower and pricier as the conversation grows, yet nothing on screen tells you when that is happening. The fix is a small script that lets the claude code status line show context usage, an estimated cost and more, all in the row under your prompt. In this guide we built one, ran it in a real session and measured what the numbers actually do.
This is Part 34 of 45 in our Claude Code Deep Dives, part of our Claude Code tutorials. In the last part we covered every CLAUDE.md location, and for the basics of styling the bar itself, see our guide to customizing the status line.
Tested with Claude Code v2.1.322 on November 12, 2026, on macOS. Everything ran in a throwaway demo folder with --setting-sources project, so our personal Claude Code setup stayed untouched. We did not use any Windows or Linux machine; the Windows steps come from Anthropic’s official docs.
Quick Summary
| What you want to see | Field to read | Good to know |
|---|---|---|
| How full the context is | context_window.used_percentage | Counts input tokens only, not output |
| Token count and window size | context_window.total_input_tokens and context_window.context_window_size | Size was 1,000,000 on our model |
| Session cost | cost.total_cost_usd | An estimate at list price, not your bill |
| Cache health | prompt_cache.hit_ratio | A number from 0 to 1 |
| Session time | cost.total_duration_ms | In milliseconds |
What the Claude Code Status Line Is
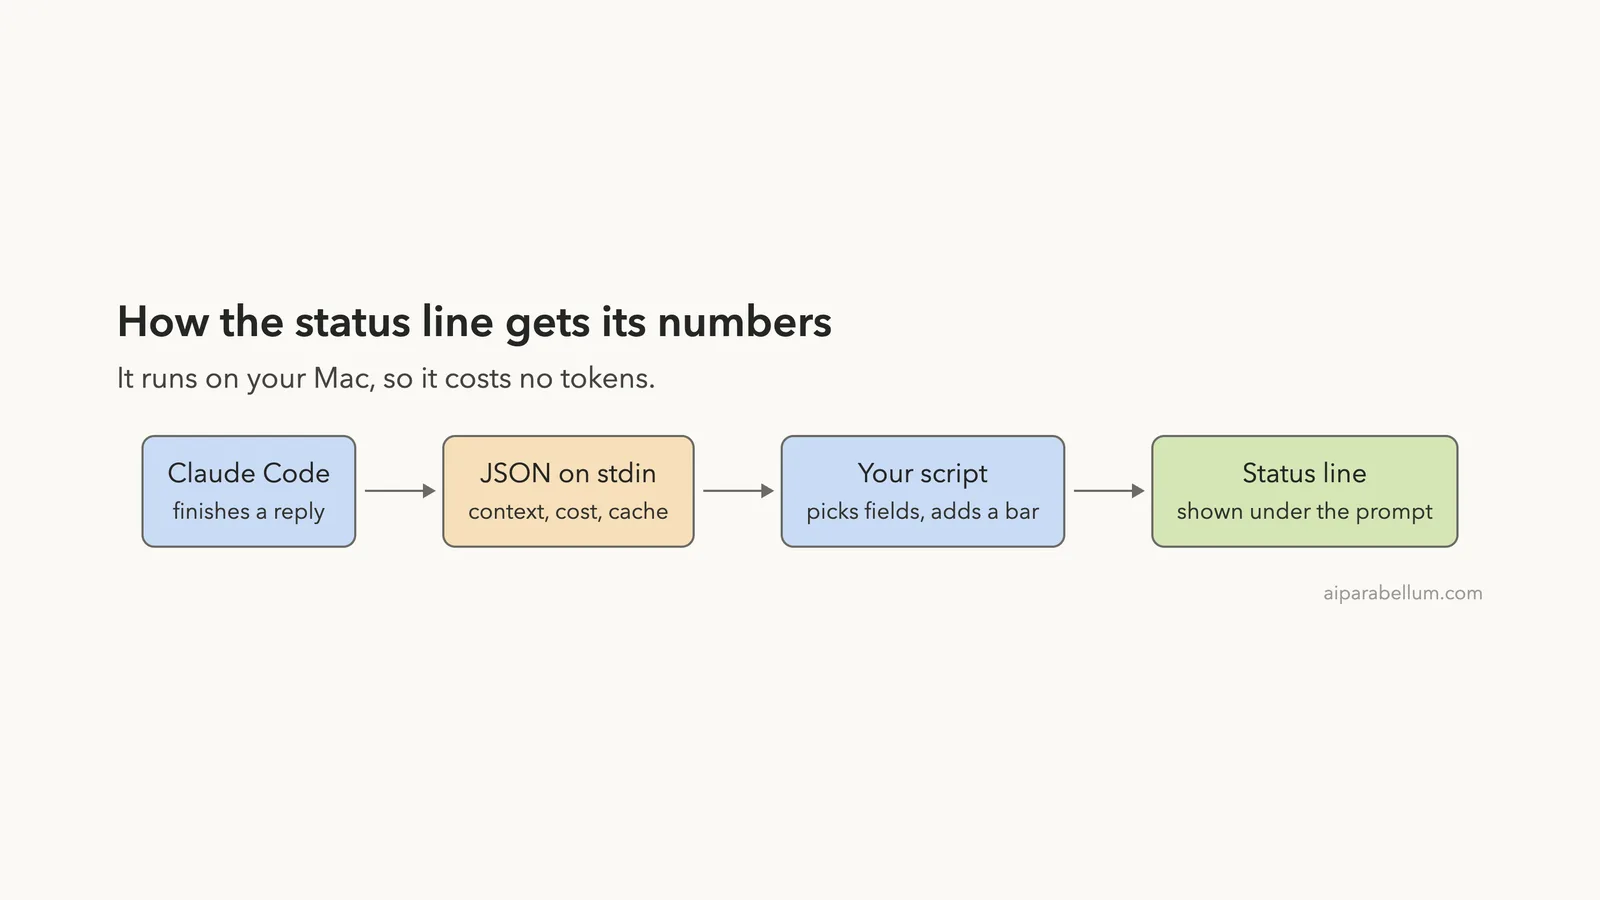
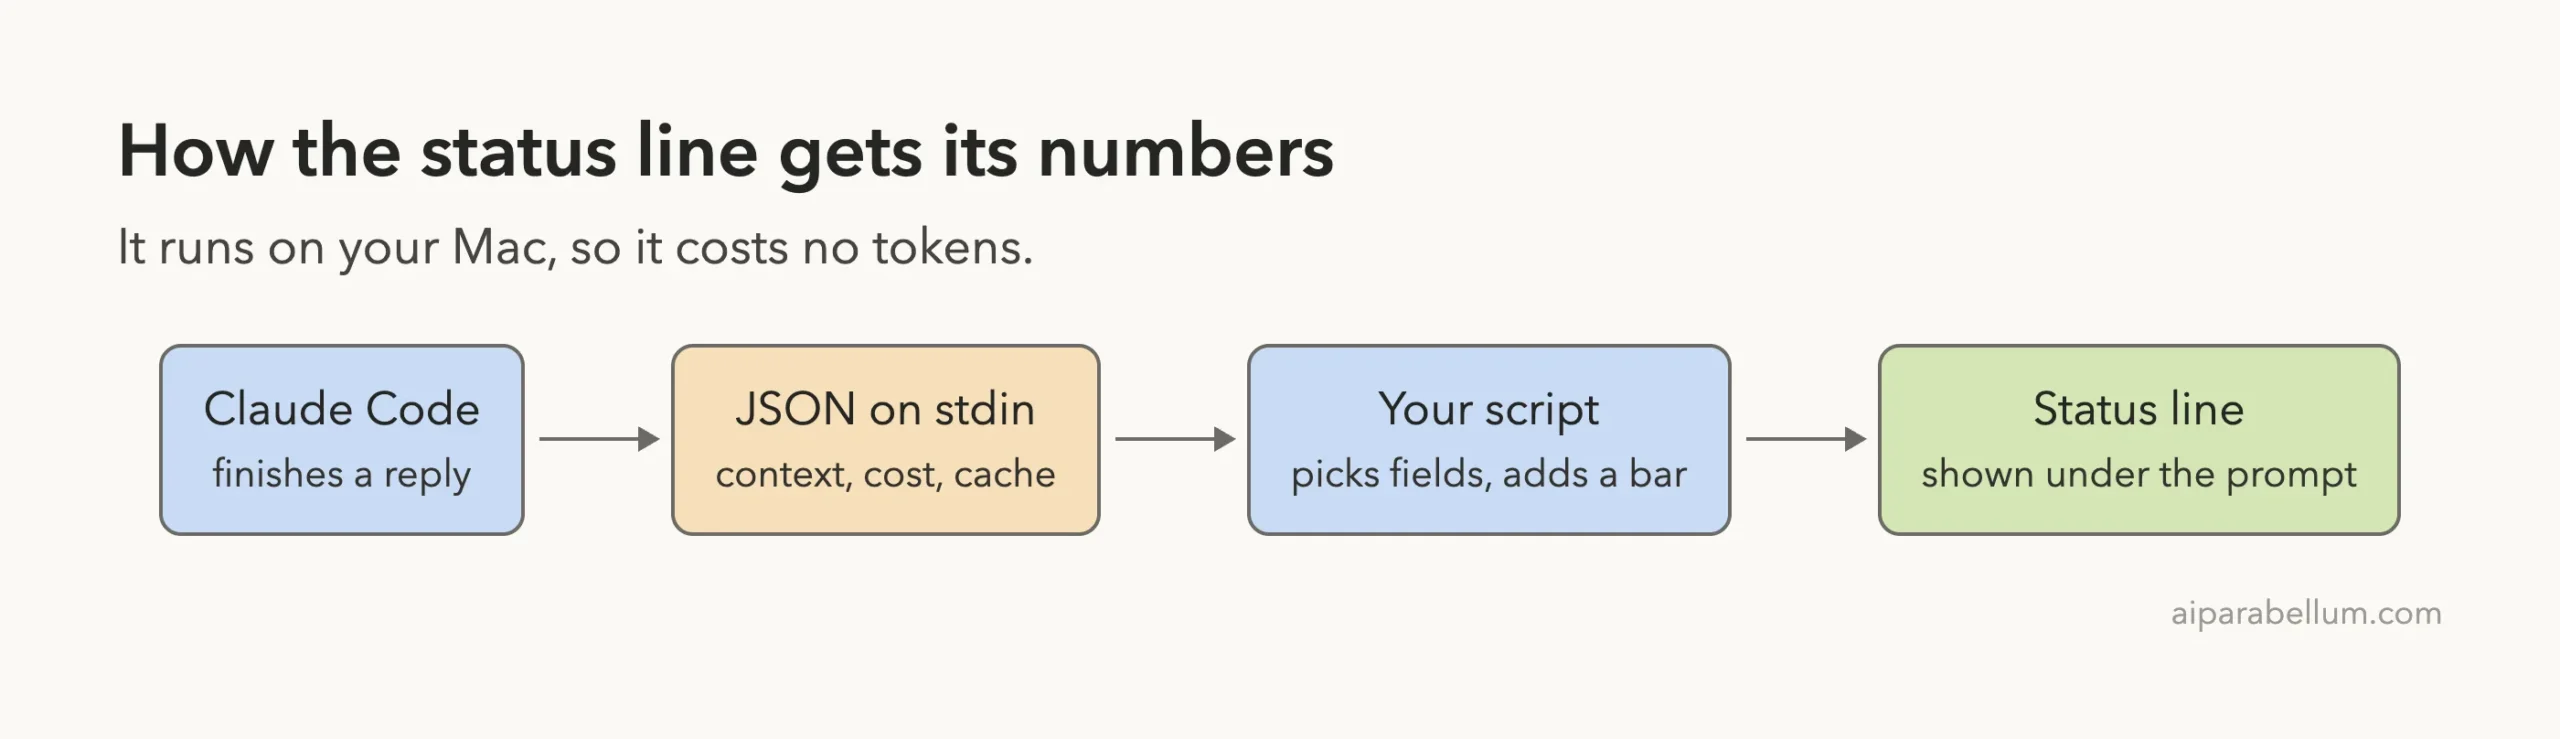
The status line is a bar at the bottom of Claude Code that runs a shell command you choose. Claude Code sends your script a block of JSON about the session on stdin, and whatever your script prints becomes the bar. That makes it the easiest way to keep context usage and cost in view without typing a command.
The official docs say it runs locally and does not use API tokens. So adding one costs you nothing in usage, which is a good reason to try it.
Which Fields Show Context Usage and Cost
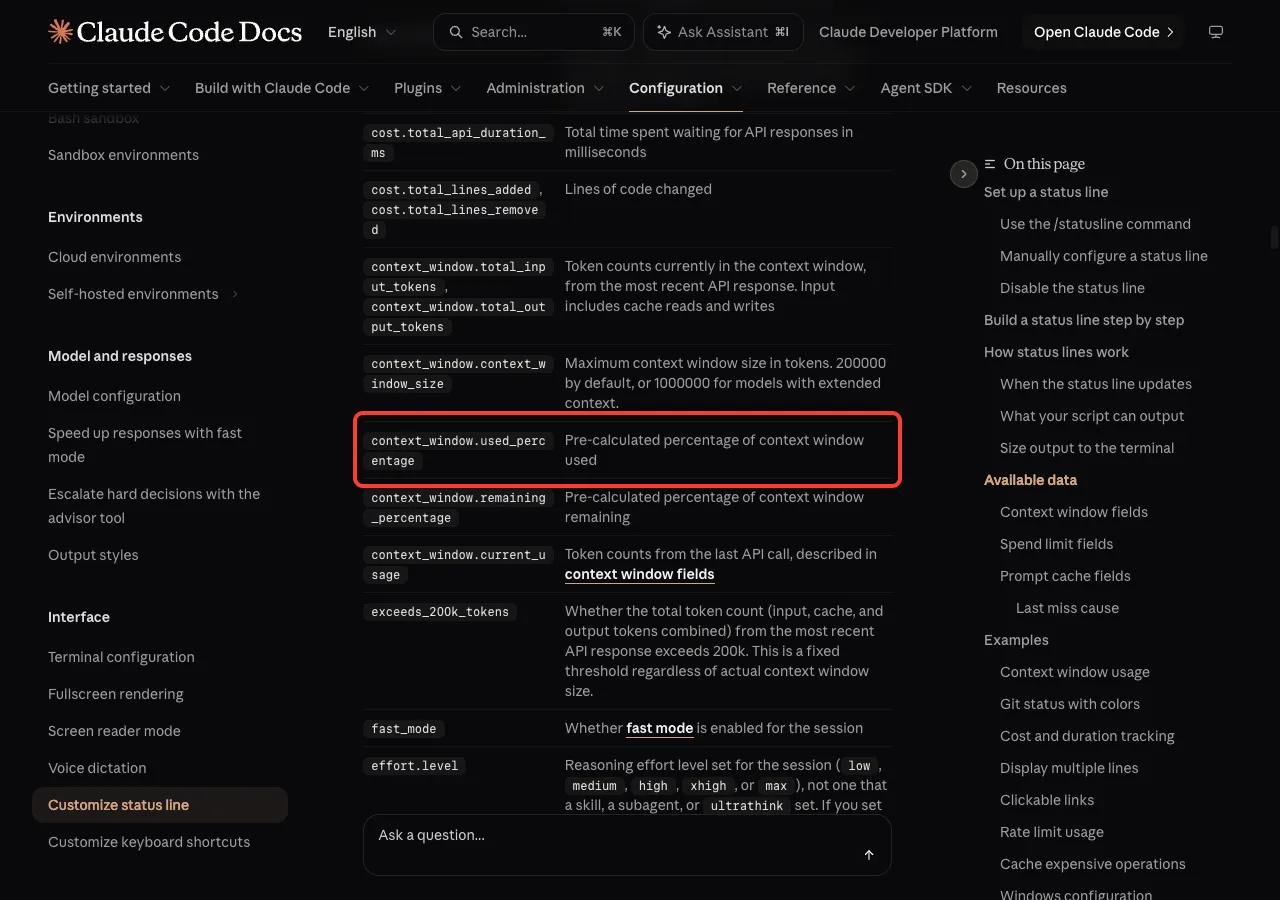
The docs list every field your script receives. Four of them cover most of what people want to watch.
context_window.used_percentageis a ready-made percentage, so you do not have to do any math.context_window.context_window_sizeis the maximum size, 200,000 by default or 1,000,000 for models with extended context.cost.total_cost_usdis the running cost of the session.prompt_cache.hit_ratioshows how much of your input is served from the cache.
One detail trips people up. The docs say used_percentage is calculated from input tokens only, meaning input_tokens, cache_creation_input_tokens and cache_read_input_tokens. Output tokens are not part of it.
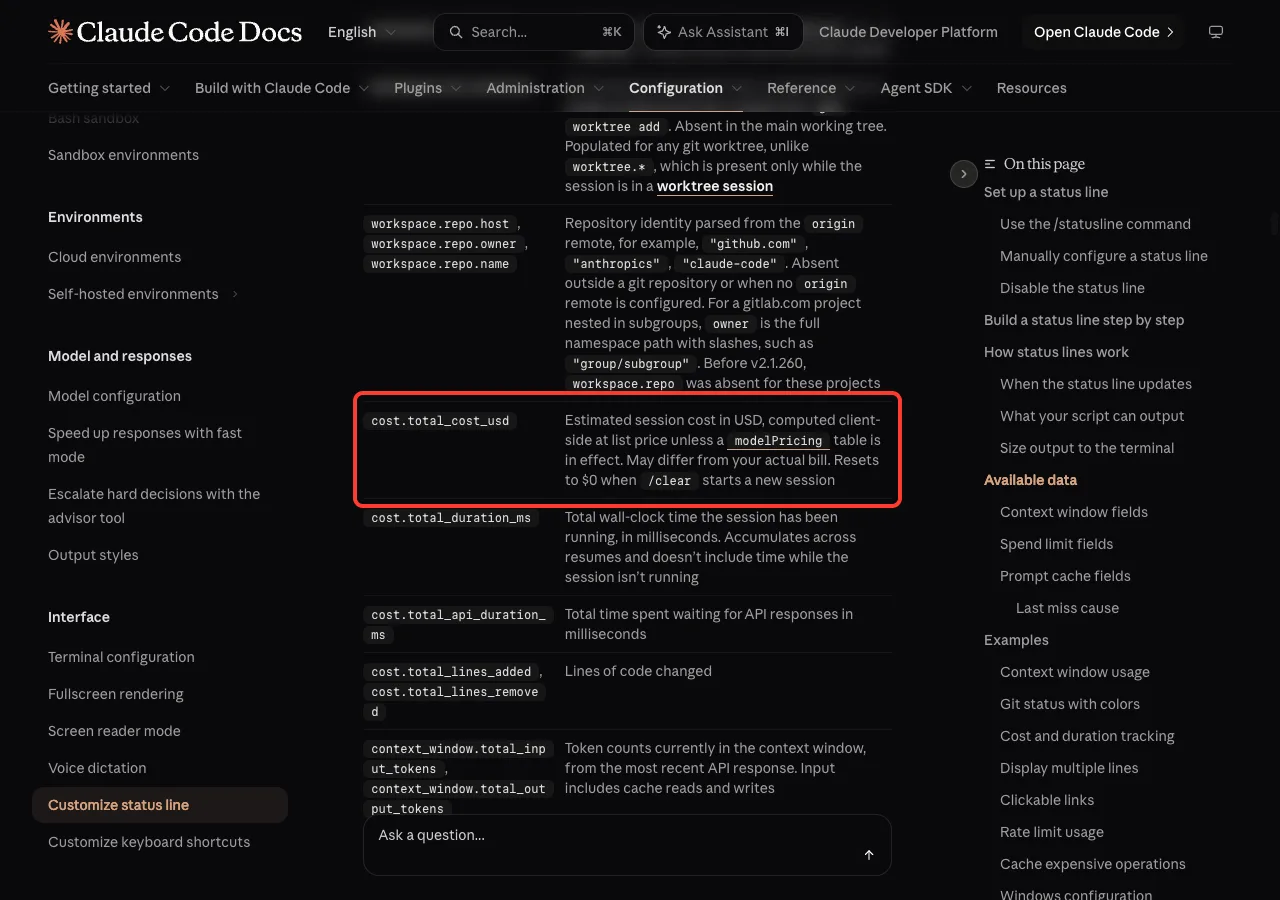
The cost field has its own caveat. The docs describe it as an estimate computed on your machine at list price, so it may differ from your actual bill. It also resets to zero when /clear starts a new session.
Build a Status Line With Context Usage and Cost
You can ask Claude to build one with /statusline and a plain sentence. We wanted full control, so we wrote our own script in a demo project. It prints two lines: a colored bar with token counts, then cost, time and cache hit rate.
Step 1: Write the Script
Save this as .claude/statusline.py in your project. It uses Python, so you do not need jq.
#!/usr/bin/env python3
import json, sys

d = json.load(sys.stdin)
model = d.get("model", {}).get("display_name", "?")
cw = d.get("context_window", {}) or {}
pct = int(cw.get("used_percentage") or 0)
size = cw.get("context_window_size") or 200000
used = cw.get("total_input_tokens") or 0
cost = (d.get("cost", {}) or {}).get("total_cost_usd") or 0
mins = int(((d.get("cost", {}) or {}).get("total_duration_ms") or 0) // 60000)
ratio = (d.get("prompt_cache") or {}).get("hit_ratio")

GREEN, YELLOW, RED, DIM, RESET = "\033[32m", "\033[33m", "\033[31m", "\033[2m", "\033[0m"
color = GREEN if pct < 50 else YELLOW if pct < 80 else RED
filled = pct * 10 // 100
bar = "▓" * filled + "░" * (10 - filled)

print(f"[{model}] {color}{bar} {pct}%{RESET} {DIM}{used:,} / {size:,} tokens{RESET}")
line2 = f"${cost:.2f} · {mins}m"
if ratio is not None:
    line2 += f" · cache hit {int(ratio * 100)}%"
print(line2)
Every field has a fallback, so the script still prints something when a value is missing. That matters early in a session, because the docs say used_percentage may be null before the first response.
Step 2: Make It Runnable and Add It to Settings
Run chmod +x .claude/statusline.py, then add a statusLine entry to .claude/settings.json.
{
  "statusLine": {
    "type": "command",
    "command": "python3 .claude/statusline.py"
  }
}
We put this in the project file so it stays inside the demo. You can put the same block in your user settings instead if you want it everywhere. Our settings guide explains the difference.
Step 3: Test It Before You Trust It
The docs suggest feeding the script fake JSON first, which is much faster than waiting for a real session. We piped three made-up sessions at 20, 65 and 92 percent through it. This output is from our script in a plain terminal, not from Claude Code.
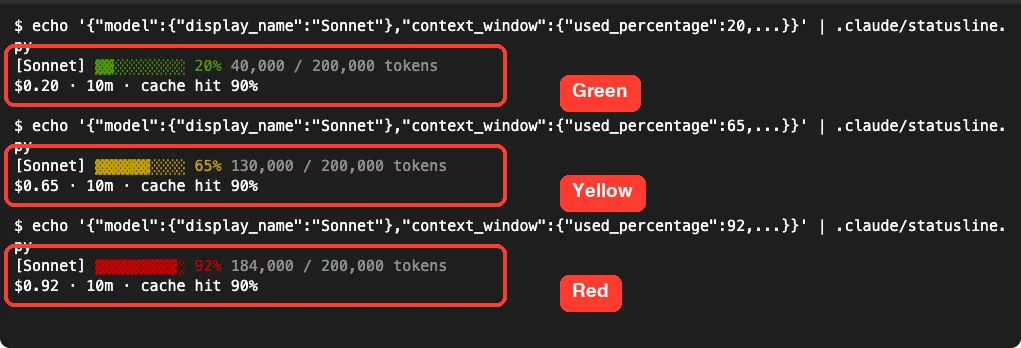
The colors switch at 50 and 80 percent, which are our own picks. Change them to whatever warns you early enough, since the docs do not set any threshold.
See It Work in a Real Session
Next we started Claude Code in the demo folder with --setting-sources project. Before we typed anything, the bar already showed up under the prompt.

It read 0 percent, 0 tokens and $0.00. That fits the docs, which say the script runs once when a session starts, before any API call.
After the First Reply
We asked Claude to read a tiny file and explain it in two sentences. When the reply arrived, the bar updated by itself.
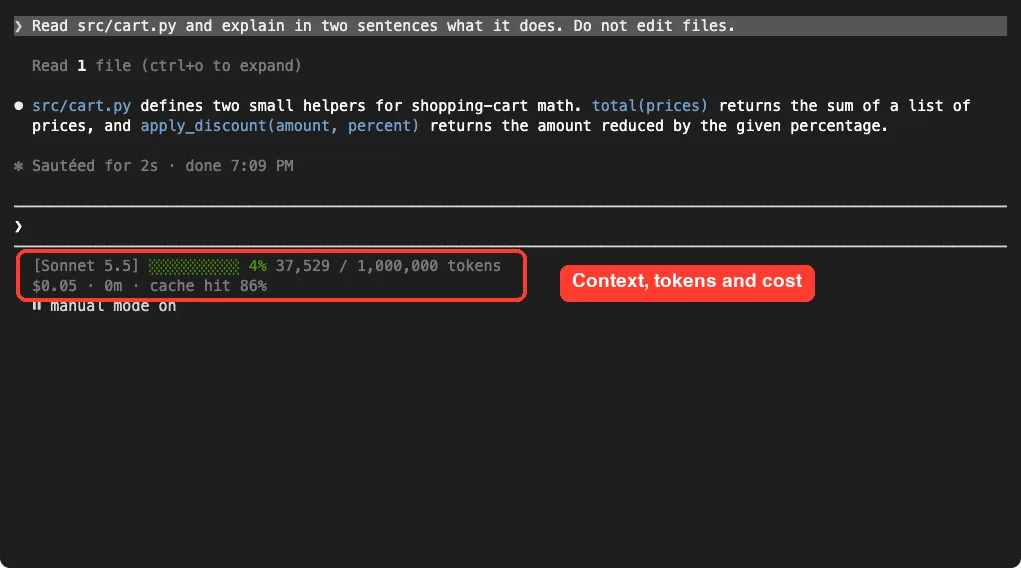
Here is the surprise. A two-sentence answer about a six-line file already used 37,529 input tokens and about five cents.
The file was not the cause. The rest is Claude Code’s own starting context, such as its instructions, tool definitions and skill lists, which you can see by running /context.
The window size shown was 1,000,000 tokens on this model, so 37,529 tokens rounds to 4 percent. On a 200,000 window the same count would read about 19 percent, so always check the size next to the percentage.
After the Second Reply
We then asked for one test case idea. The bar moved again, but only a little.
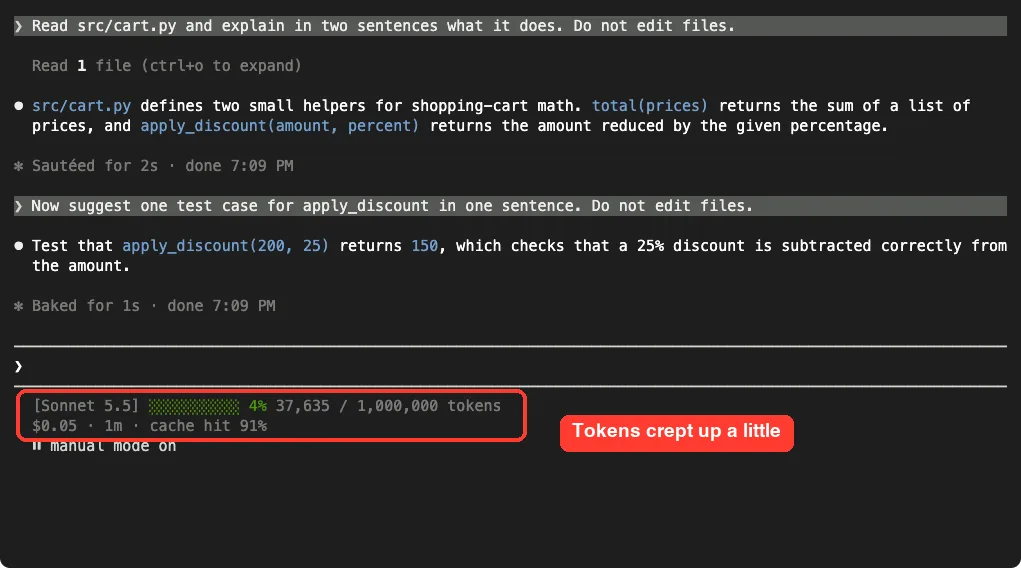
Tokens went from 37,529 to 37,635, so the second small prompt added about 100. The cache hit rate rose from 86 to 91 percent. That is what you want to see, since cached input is cheaper than fresh input.
Cost stayed at $0.05 in both screenshots. Our two prompts were tiny, so you would need much longer work before the number visibly climbs. We did not run a long task, so we cannot show a bar near the red zone from a real session.
When the Status Line Refreshes
The bar does not update every second. The docs list the triggers: a new assistant message, /compact finishing, a permission mode change, a Vim mode toggle, a changed command setting, and timers when you configure them.
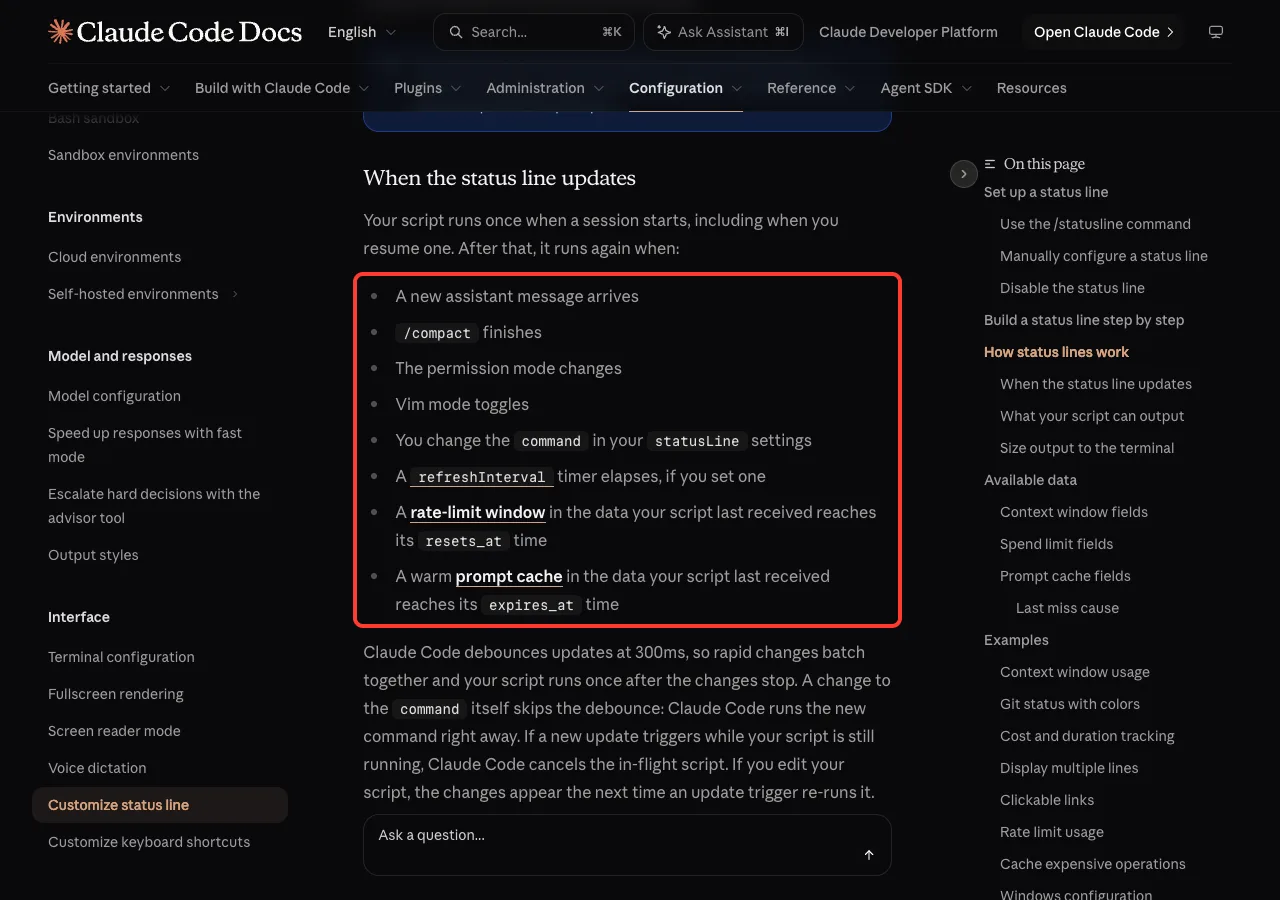
Updates are debounced at 300ms, and a new update cancels a script that is still running. If your bar shows a clock or other live data, set refreshInterval so it re-runs every N seconds. For context and cost you do not need it, since both only change when a reply arrives.
Read the Numbers Without Fooling Yourself
A few facts keep you from misreading the bar.
- The percentage is input only, so a very long reply does not move it directly.
- Right after
/compact, the docs saycurrent_usageis null until the next API call, so numbers can look odd for one turn. - The cost is an estimate at list price, so use it to compare sessions, not to reconcile a bill.
- Cost resets with
/clear, so a $0.00 after clearing is expected.
If you track memory files and their size, our memory system guide shows where much of that starting context comes from. For a related token worry, see a token usage fix.
The status line costs no tokens, so there is no reason to fly blind on context and cost.
Try It Yourself
Make a tiny project, add the script and settings above, and start Claude Code there. Then paste this prompt and watch the bar change.
Read every file in this folder and summarize each one in one line. Do not edit files.Run /context afterward and compare its total with the token count on your bar. If you want a challenge, change the thresholds and add cost.total_lines_added so you can see how much code changed.
Common Mistakes
- Forgetting
chmod +x, which leaves the bar blank. - Printing to stderr instead of stdout. Only stdout is shown.
- Using a path that depends on your current folder. Use a project-relative or absolute path you have tested.
- Making the script slow. The docs warn that slow scripts block updates, so avoid heavy commands.
- Treating the cost as your invoice.
- Reading the percentage without looking at the window size.
Pro Tips
- Test with fake JSON first, then with a real session.
- Run
claude --debugto see your script’s errors when the bar goes blank. - Keep the output short, because long lines get truncated on narrow terminals.
- Use
/statuslineand describe what you want if you would rather not write the script yourself. - Show the cache hit rate only if you care about it. Fewer items make a calmer bar.
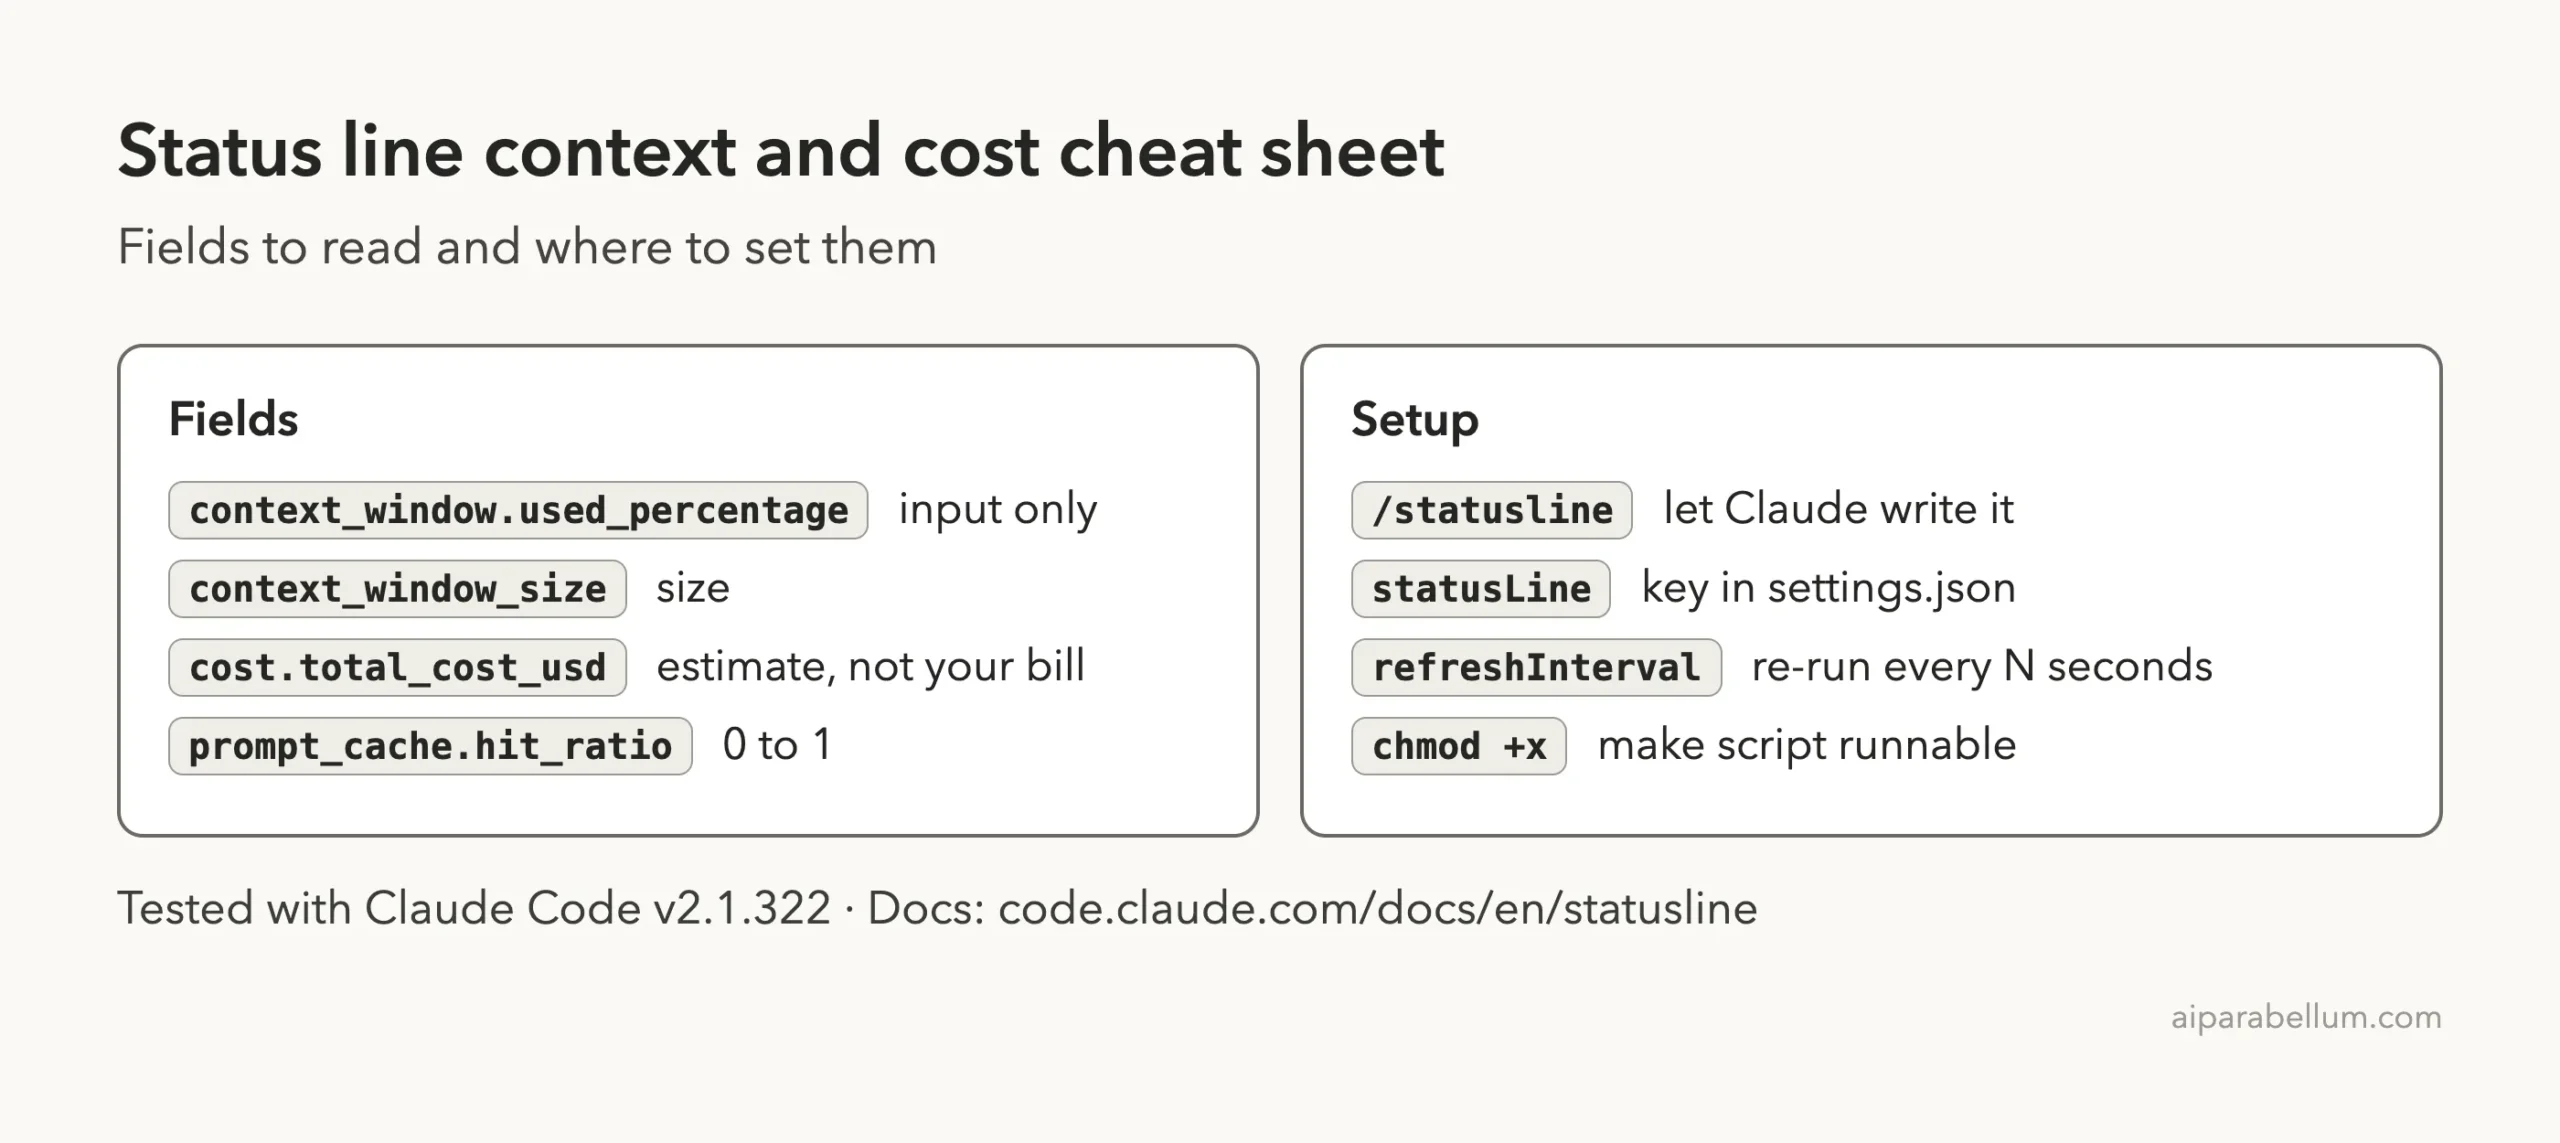
Cheat Sheet
Frequently Asked Questions
Does the Claude Code status line cost tokens?
No. The docs say it runs locally and does not consume API tokens.
How do I show context usage in the status line?
Read context_window.used_percentage from the JSON your script receives and print it, ideally next to context_window_size.
Is the cost in the status line my real bill?
No. It is an estimate at list price and may differ from your actual bill, according to the docs.
Why is my context already at a few percent before I do anything?
Claude Code adds its own instructions, tools and skill lists to every session. In our test, one tiny reply already showed 37,529 tokens.
Why is my status line blank?
Check that the script is executable, prints to stdout and exits cleanly. Run it by hand with fake JSON, or start Claude Code with claude --debug.
Conclusion
A short script is all it takes to keep context usage, estimated cost and cache health on screen while you work. In our real session, the bar showed a 37,529-token starting context, about five cents and a rising cache hit rate, none of which we would have noticed otherwise. Build the script, test it with fake JSON, pick thresholds that suit you, and read the official cost documentation or our overview of Claude for more.
Previous in the series: Part 33: CLAUDE.md Locations
Next in the series: Part 35: Claude Code Stop Hook: Examples You Can Copy.