The Claude Code session report plugin reads your past sessions and builds one HTML page that shows where your tokens went. It counts input, output and cache use, then ranks your most expensive prompts. This guide shows what it did on a small demo, what each number means, and how to read a report like this one.
This guide is part of our Claude Code tutorials. Find more add-ons in our Skills Directory.
Tested with Claude Code v2.1.319 on 2026-11-09 (macOS), using the session-report plugin from anthropics/claude-plugins-official at commit 0412be7 (dated 2026-11-06).
We read every file in the plugin first, then loaded it into a throwaway sandbox. We never installed it into our own setup.
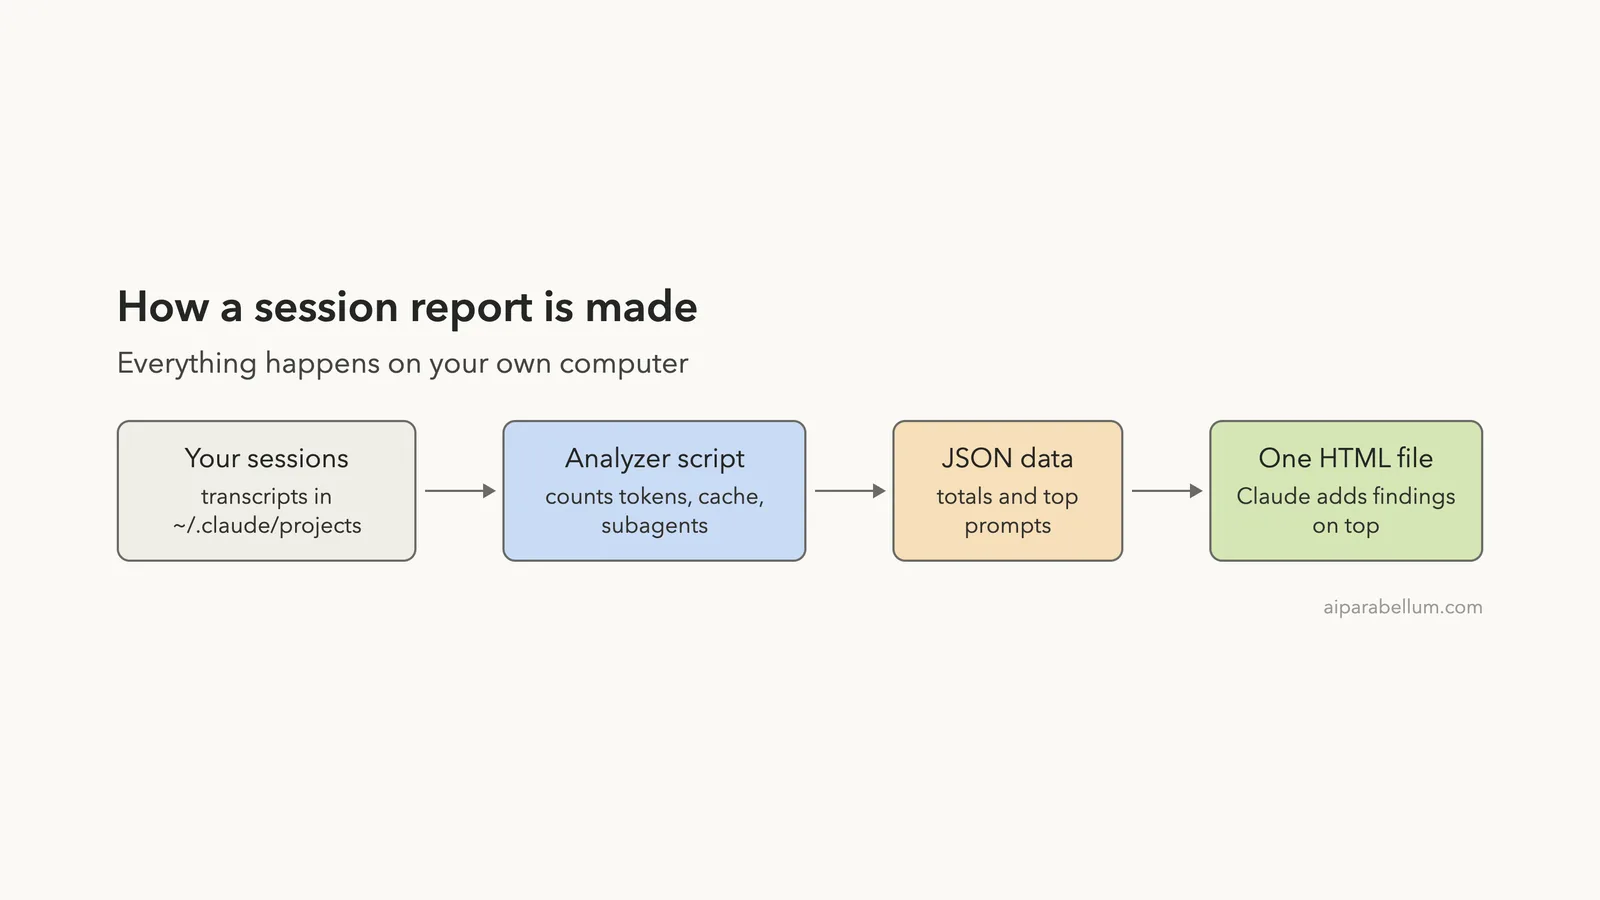
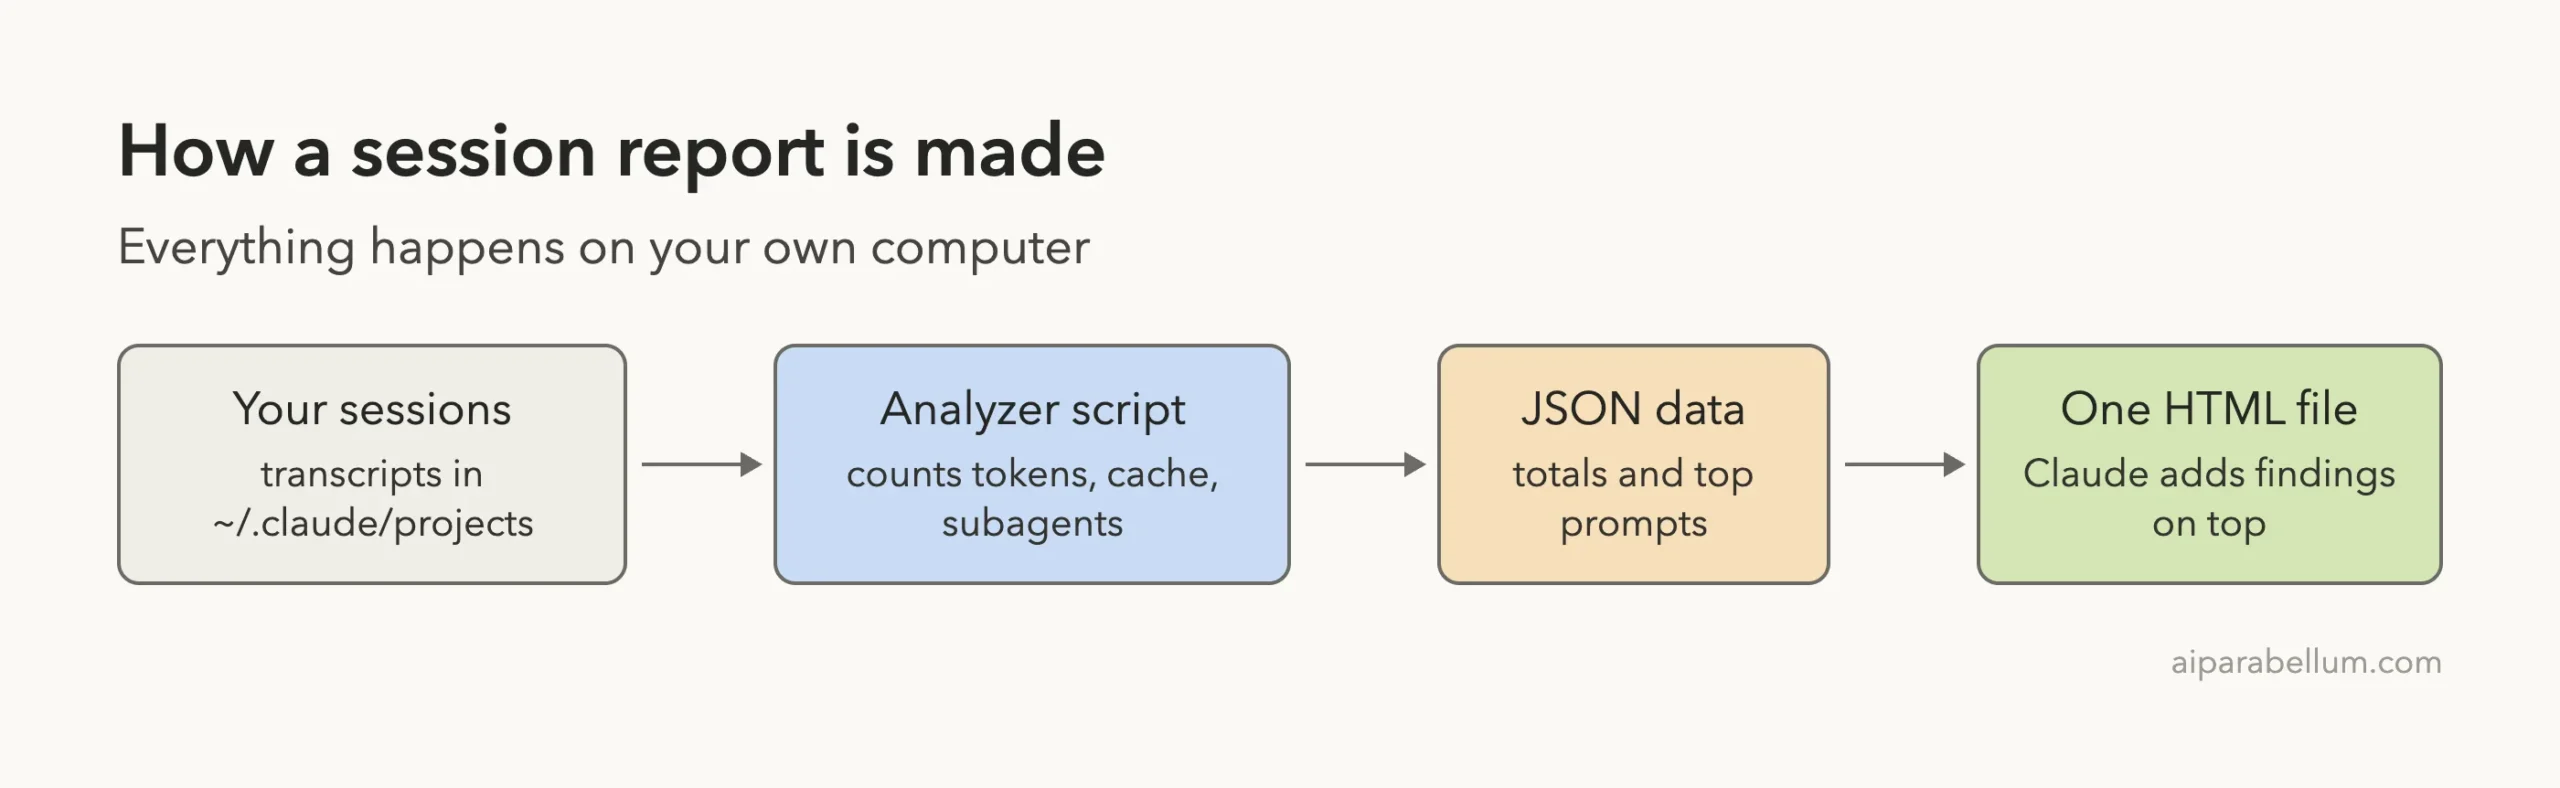
One thing needs saying up front: the plugin reads all your local transcripts, so running it on our real history would have put private project names in the screenshots. We ran the plugin’s own analyzer script on the transcripts of a small demo session instead, and we filled in the report page by following the steps in the plugin’s skill file.
Quick Summary: What the Session Report Plugin Does
| Question | Answer from our test |
|---|---|
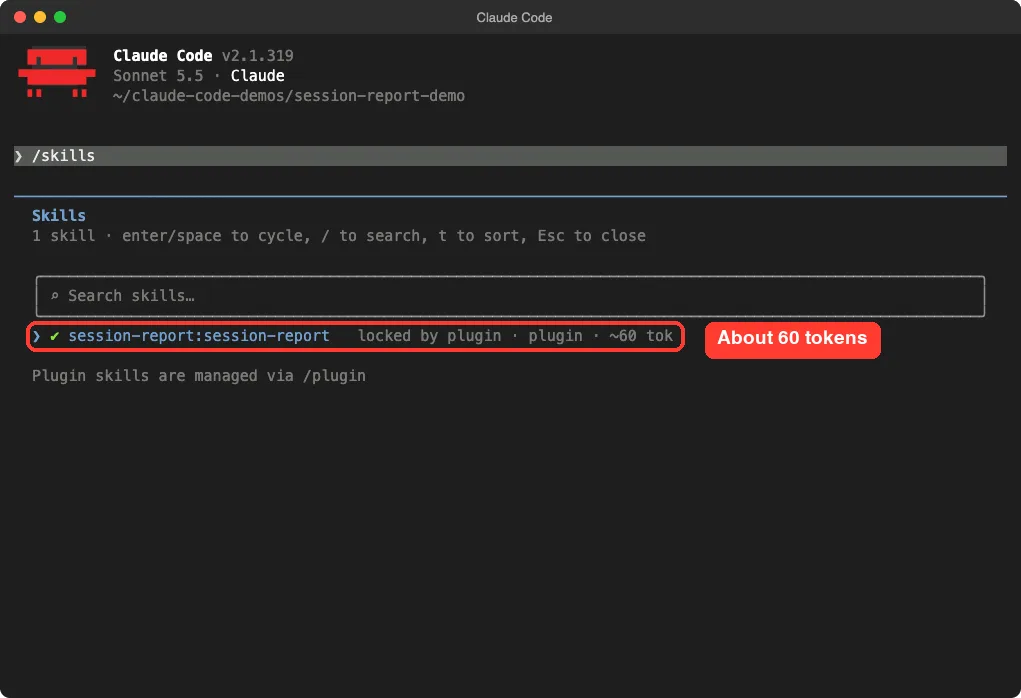
| What does it add? | One skill, session-report:session-report, listed at about 60 tokens in /skills |
| What does it make? | A self-contained HTML report saved in your current folder |
| Where does the data come from? | The transcript files in ~/.claude/projects on your own computer |
| Does it need an account or API key? | No |
| Does it run network calls or hooks? | The plugin has no hooks and no MCP servers; the report page loads one web font |
| Default window | The last 7 days; you can ask for 24h, 30d or all |
| Install command | /plugin install session-report@claude-plugins-official |
What Is the Claude Code Session Report Plugin?
Every Claude Code session is saved as a transcript on your computer. Each reply in that transcript records how many tokens it used. The session report plugin adds up those numbers for you.
Tokens are the small pieces of text Claude reads and writes. They are what your usage limit counts, so knowing where they go helps you save them.
If you want the quick built-in ways to check, our guide on checking token usage covers them. This plugin goes further by looking back over many sessions at once.
The plugin is made by Anthropic and sits in the official marketplace. It is a skill, so Claude loads its instructions when you call it. Our overview of Claude Code plugins explains how plugins are installed and managed.
What We Checked Before Running Anything
We cloned Anthropic’s plugin repository into the sandbox and opened the session-report folder. It holds five files: a license, a plugin.json file, a SKILL.md file, a script called analyze-sessions.mjs and a page called template.html.
The script only reads files and prints results. It has no network calls and no code that runs other programs, and it writes nothing by itself.
The skill tells Claude to run the script, copy the template into your current folder, and fill in the findings. It also tells Claude not to open or render the page.
The one outside request is in the page template, which loads a font from Google Fonts. The page still works without it, but your browser will ask for the font when you open the report.
Step 1: Load the Plugin in a Sandbox
Instead of installing, we started Claude Code with the --plugin-dir flag and the --setting-sources project flag. That loads the plugin for one session only and keeps your own settings out of the way.
claude --plugin-dir ./plugins/session-report --setting-sources projectTyping /skills showed one skill, session-report:session-report, marked as locked by plugin at about 60 tokens. That is the cost of keeping it enabled, because Claude Code lists each skill’s name and description in context.
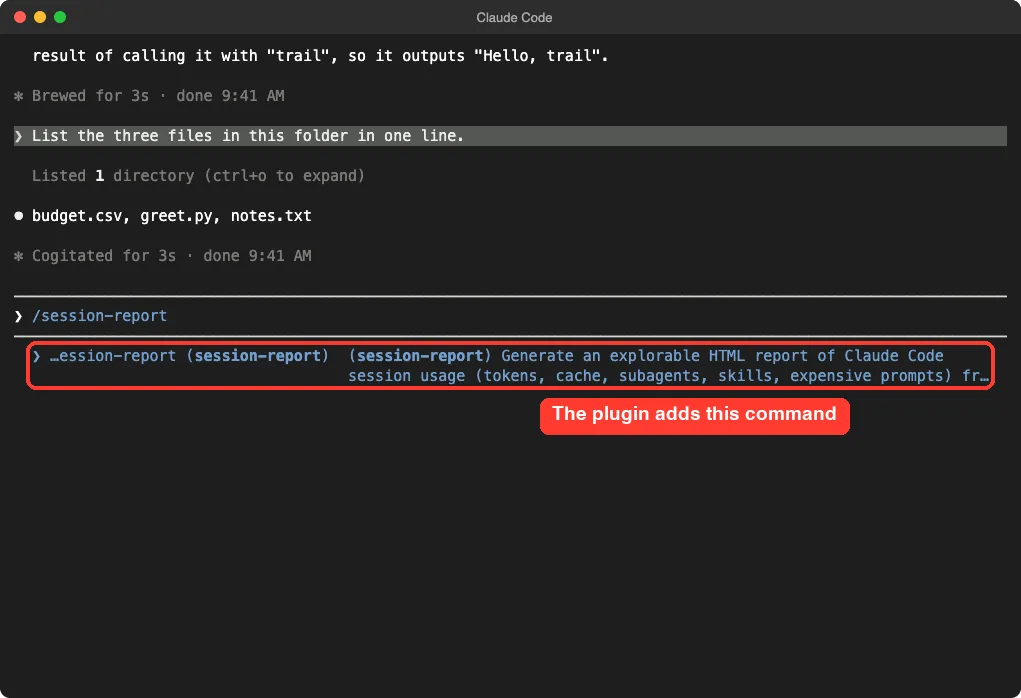
Typing /session-report also brought up the command in the suggestion list, with its description beside it.
Step 2: Create Some Sessions to Measure
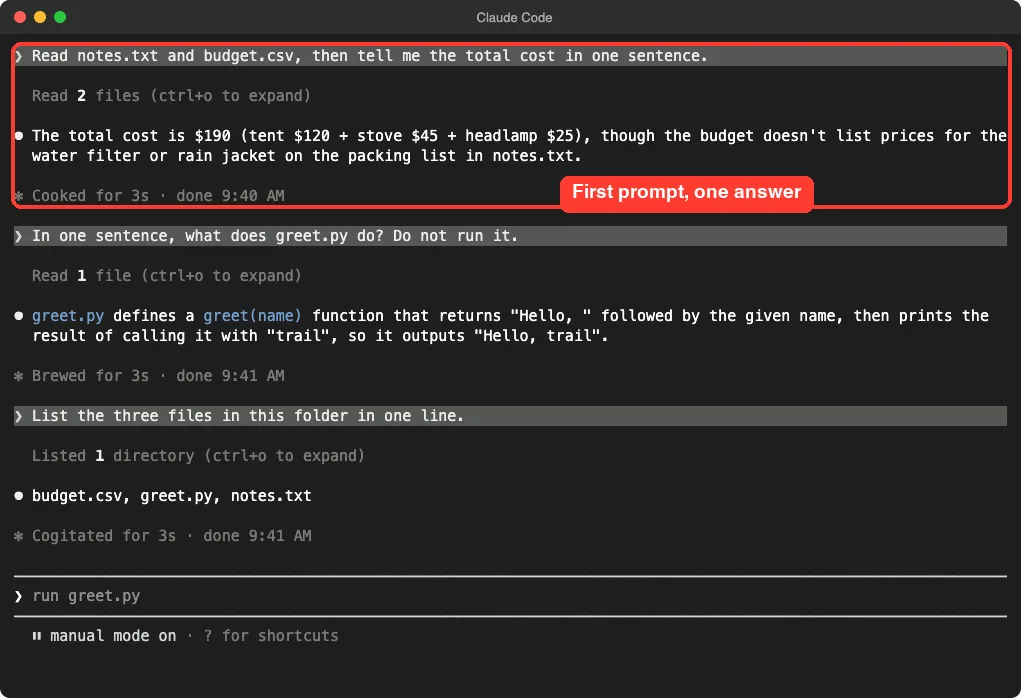
A report needs data, so we made a demo folder with three tiny files: a packing list, a small budget file and a short Python script. Then we asked Claude three short questions, one after another, in a single session.
- Read the notes and the budget, then give the total cost in one sentence.
- Say in one sentence what the script does, without running it.
- List the three files in one line.
Claude answered each one in about three seconds. It said the total was $190 and noted that two items on the packing list had no price. It described the script correctly, and it listed the three files.
Step 3: Run the Analyzer
The analyzer is the part that does the counting. Its help text shows these options: --dir, --json, --since and --top. By default it reads ~/.claude/projects.
To keep our private history out of the test, we copied only the demo session’s transcript folder into a separate folder and pointed the script at it with --dir. That flag is part of the script, so this is a normal way to use it.
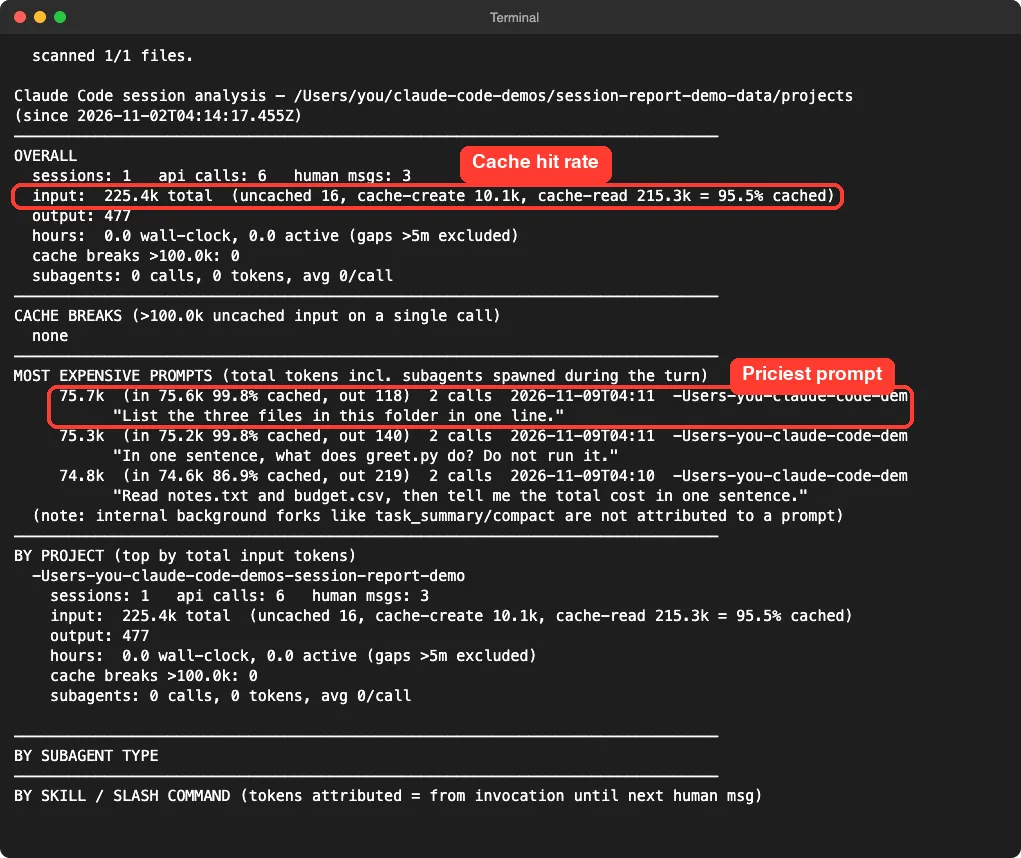
node analyze-sessions.mjs --dir ./demo-projects --since 7d --top 3The text output opens with an overall block. For our demo it said 1 session, 6 API calls and 3 human messages.
Input tokens came to 225.4k in total, and 95.5 percent of them were cache reads. Output was only 477 tokens.
How to Read the Numbers
The totals can look odd at first. Three tiny questions used 225.4k input tokens. That is not a mistake.
Each API call sends the whole conversation so far, plus Claude’s built-in instructions, and most of that is served from the cache.
| Number | In our demo | What it tells you |
|---|---|---|
| Uncached input | 16 tokens | New text Claude had to read fresh |
| Cache create | 10.1k tokens | Text stored in the cache for reuse |
| Cache read | 215.3k tokens | Text re-read from the cache at the cheaper rate |
| Output | 477 tokens | What Claude wrote back |
| API calls | 6 | About 2 per prompt: read a file, then answer |
| Cache breaks | 0 | Calls where more than 100k uncached tokens were read at once |
A high cache hit rate is good news.
The skill file suggests worrying when it falls under 85 percent. Our demo sat at 95.5 percent overall. The first prompt was lower at 86.9 percent, which makes sense, because the cache was still being filled on that first turn.
Step 4: Build the HTML Report
When you run the skill for real, Claude does three things. It runs the script with --json and saves the data, copies the template into your folder, and pastes the data into it. Then it writes three to five one-line findings and a few suggestions.
We followed those same steps by hand on the demo data. The page it makes is one file with a dark terminal look.
The big number at the top is the total, here 225.8k tokens. Under it come the findings, a summary row, bars by project and a timeline by day.
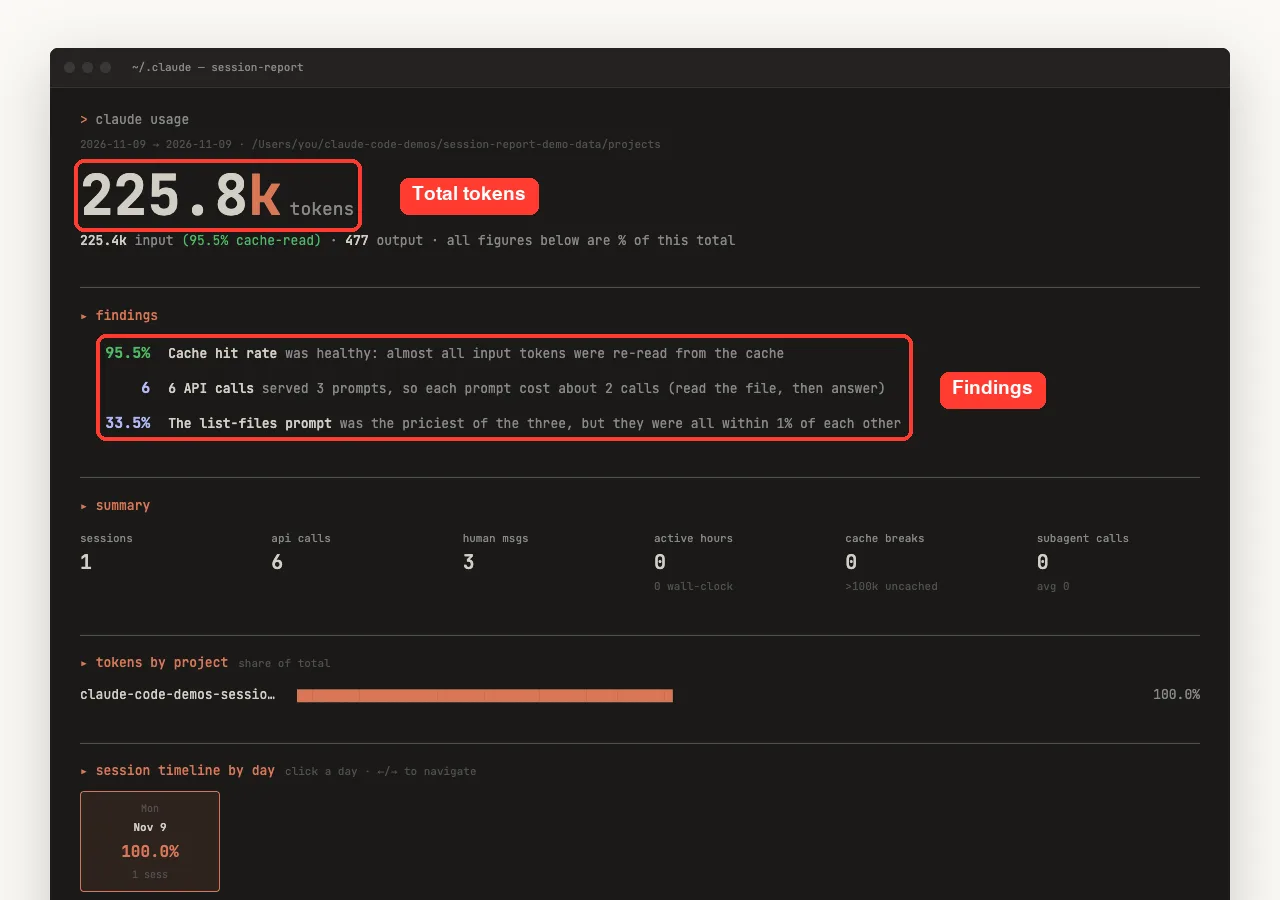
Because we wrote the findings ourselves, they only show what the demo data supports: a healthy cache rate, about two calls per prompt, and three prompts that each cost about a third of the total. On a real week of work, the findings are where Claude points at the big spenders.
The Most Expensive Prompts List
Further down the page is the list that most people will care about. It ranks your prompts by total tokens, including any subagents that prompt started. Each row shows the share of the total, the time, the project, how many calls it took and how much was cached.
In our demo the three prompts landed at 33.5, 33.4 and 33.1 percent. They were nearly equal because each question was tiny. In a real week the top row is often far ahead of the rest, and that is the prompt worth looking at first.
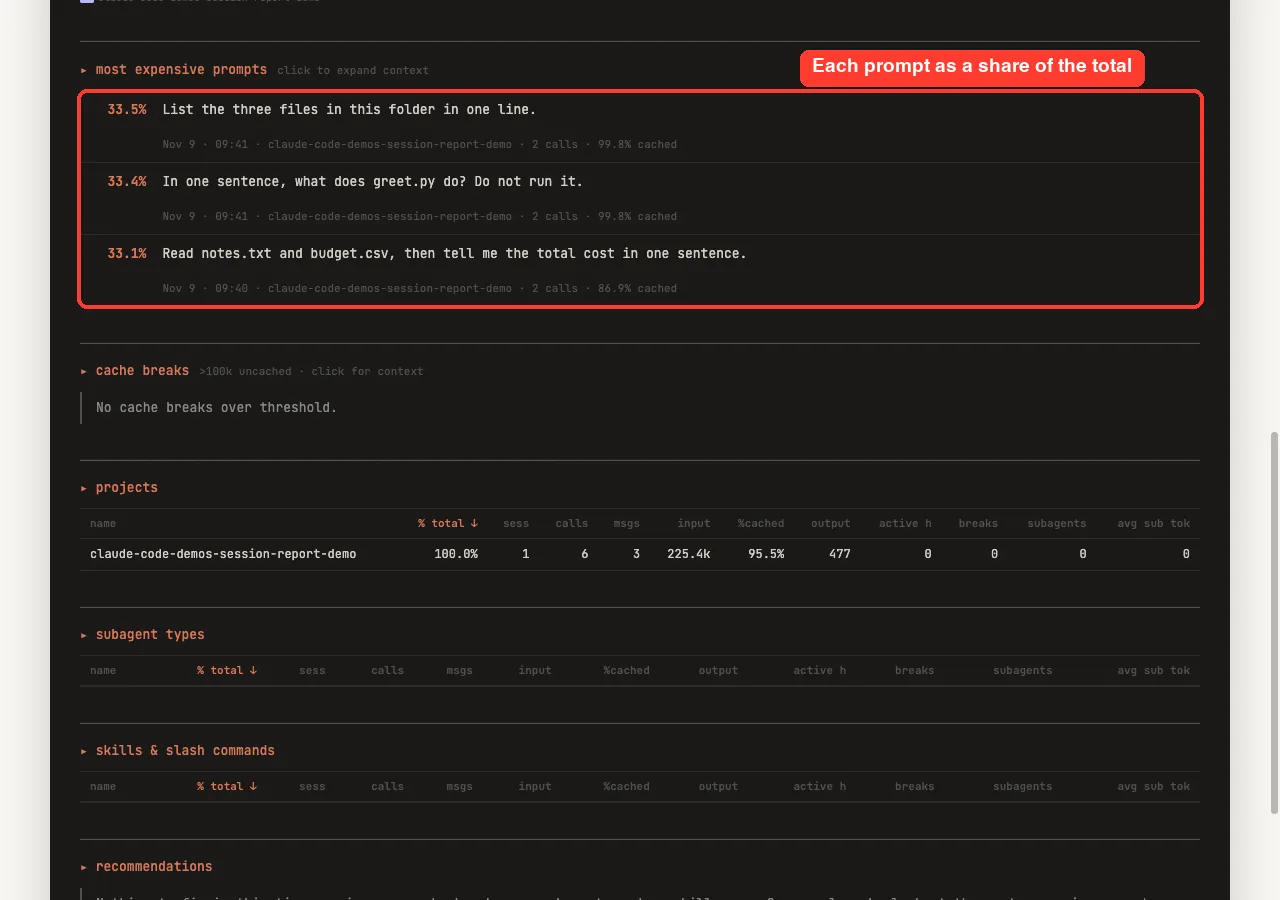
Below that you get tables for cache breaks, projects, subagent types and skills. Ours were nearly empty, since the demo used no subagents and no skills. Click a row to expand its context.
Three tiny prompts produced 225.4k input tokens, and 95.5 percent of them were cheap cache reads.
What We Could Not Test
We did not run the /session-report command all the way through. Doing so would have scanned every real project on our machine, and the report would have shown their names. We ran the analyzer on demo transcripts and built the page from the plugin’s own template instead.
That means we did not see how Claude writes the findings on a large history, how long the full skill takes, or how the page behaves with hundreds of sessions. Our demo also had no subagents, no skills and no cache breaks, so those tables stayed empty.
What Worked and What to Watch
| What worked | What to watch |
|---|---|
| The analyzer ran in about a second and its numbers matched the page | The skill reads all your transcripts, so project names and prompts appear in the report |
| The page is one file you can open offline | It asks Google Fonts for a font when you open it |
| Costs only about 60 tokens while enabled | The findings are written by Claude, so check them against the tables |
| No account, key or hook needed | We tested a tiny demo, not a heavy week of work |
Real Examples You Can Try
- Run a weekly report and look at the top three prompts.
- Run
24hafter a long session to see what one day cost. - Compare two projects by their share of the total.
- Check whether a skill or subagent is eating more than its share.
- Look for cache breaks after you changed your instructions mid-session.
For ideas on what to do with the answers, see our guide to skills versus plugins, and keep stable rules in your CLAUDE.md file so the cache stays warm.
Try It Yourself
Use a demo folder, not a real project. Start Claude Code with the plugin loaded, ask two or three small questions, then run the analyzer on a copy of that session’s folder. Skip the full skill unless you are happy for your real project names to appear in the page.
claude --plugin-dir ./plugins/session-report --setting-sources project
node analyze-sessions.mjs --dir ./demo-projects --since 7d --top 5
Look at the cache hit rate first, then the top prompt. If one prompt holds more than 2 percent of a big week, open that session and see why.
Common Mistakes
- Sharing the report without reading it. It lists your project names and prompt text.
- Panicking at big input totals. Most of it is cache reads, which cost less.
- Judging a tiny sample. Three prompts say little about your habits.
- Forgetting the window. The default is 7 days, so older work is left out.
- Trusting the written findings blindly. Check them against the tables.
Pro Tips
- Run it weekly and keep the files, so you can compare one week with the next.
- Use
--topto see more rows when the list is long. - Disable the plugin in
/pluginwhen you do not need it, as the official plugins overview describes. - Read plugin discovery guide before adding any marketplace.
- Ask Claude for a shorter window like
24hright after a heavy task.
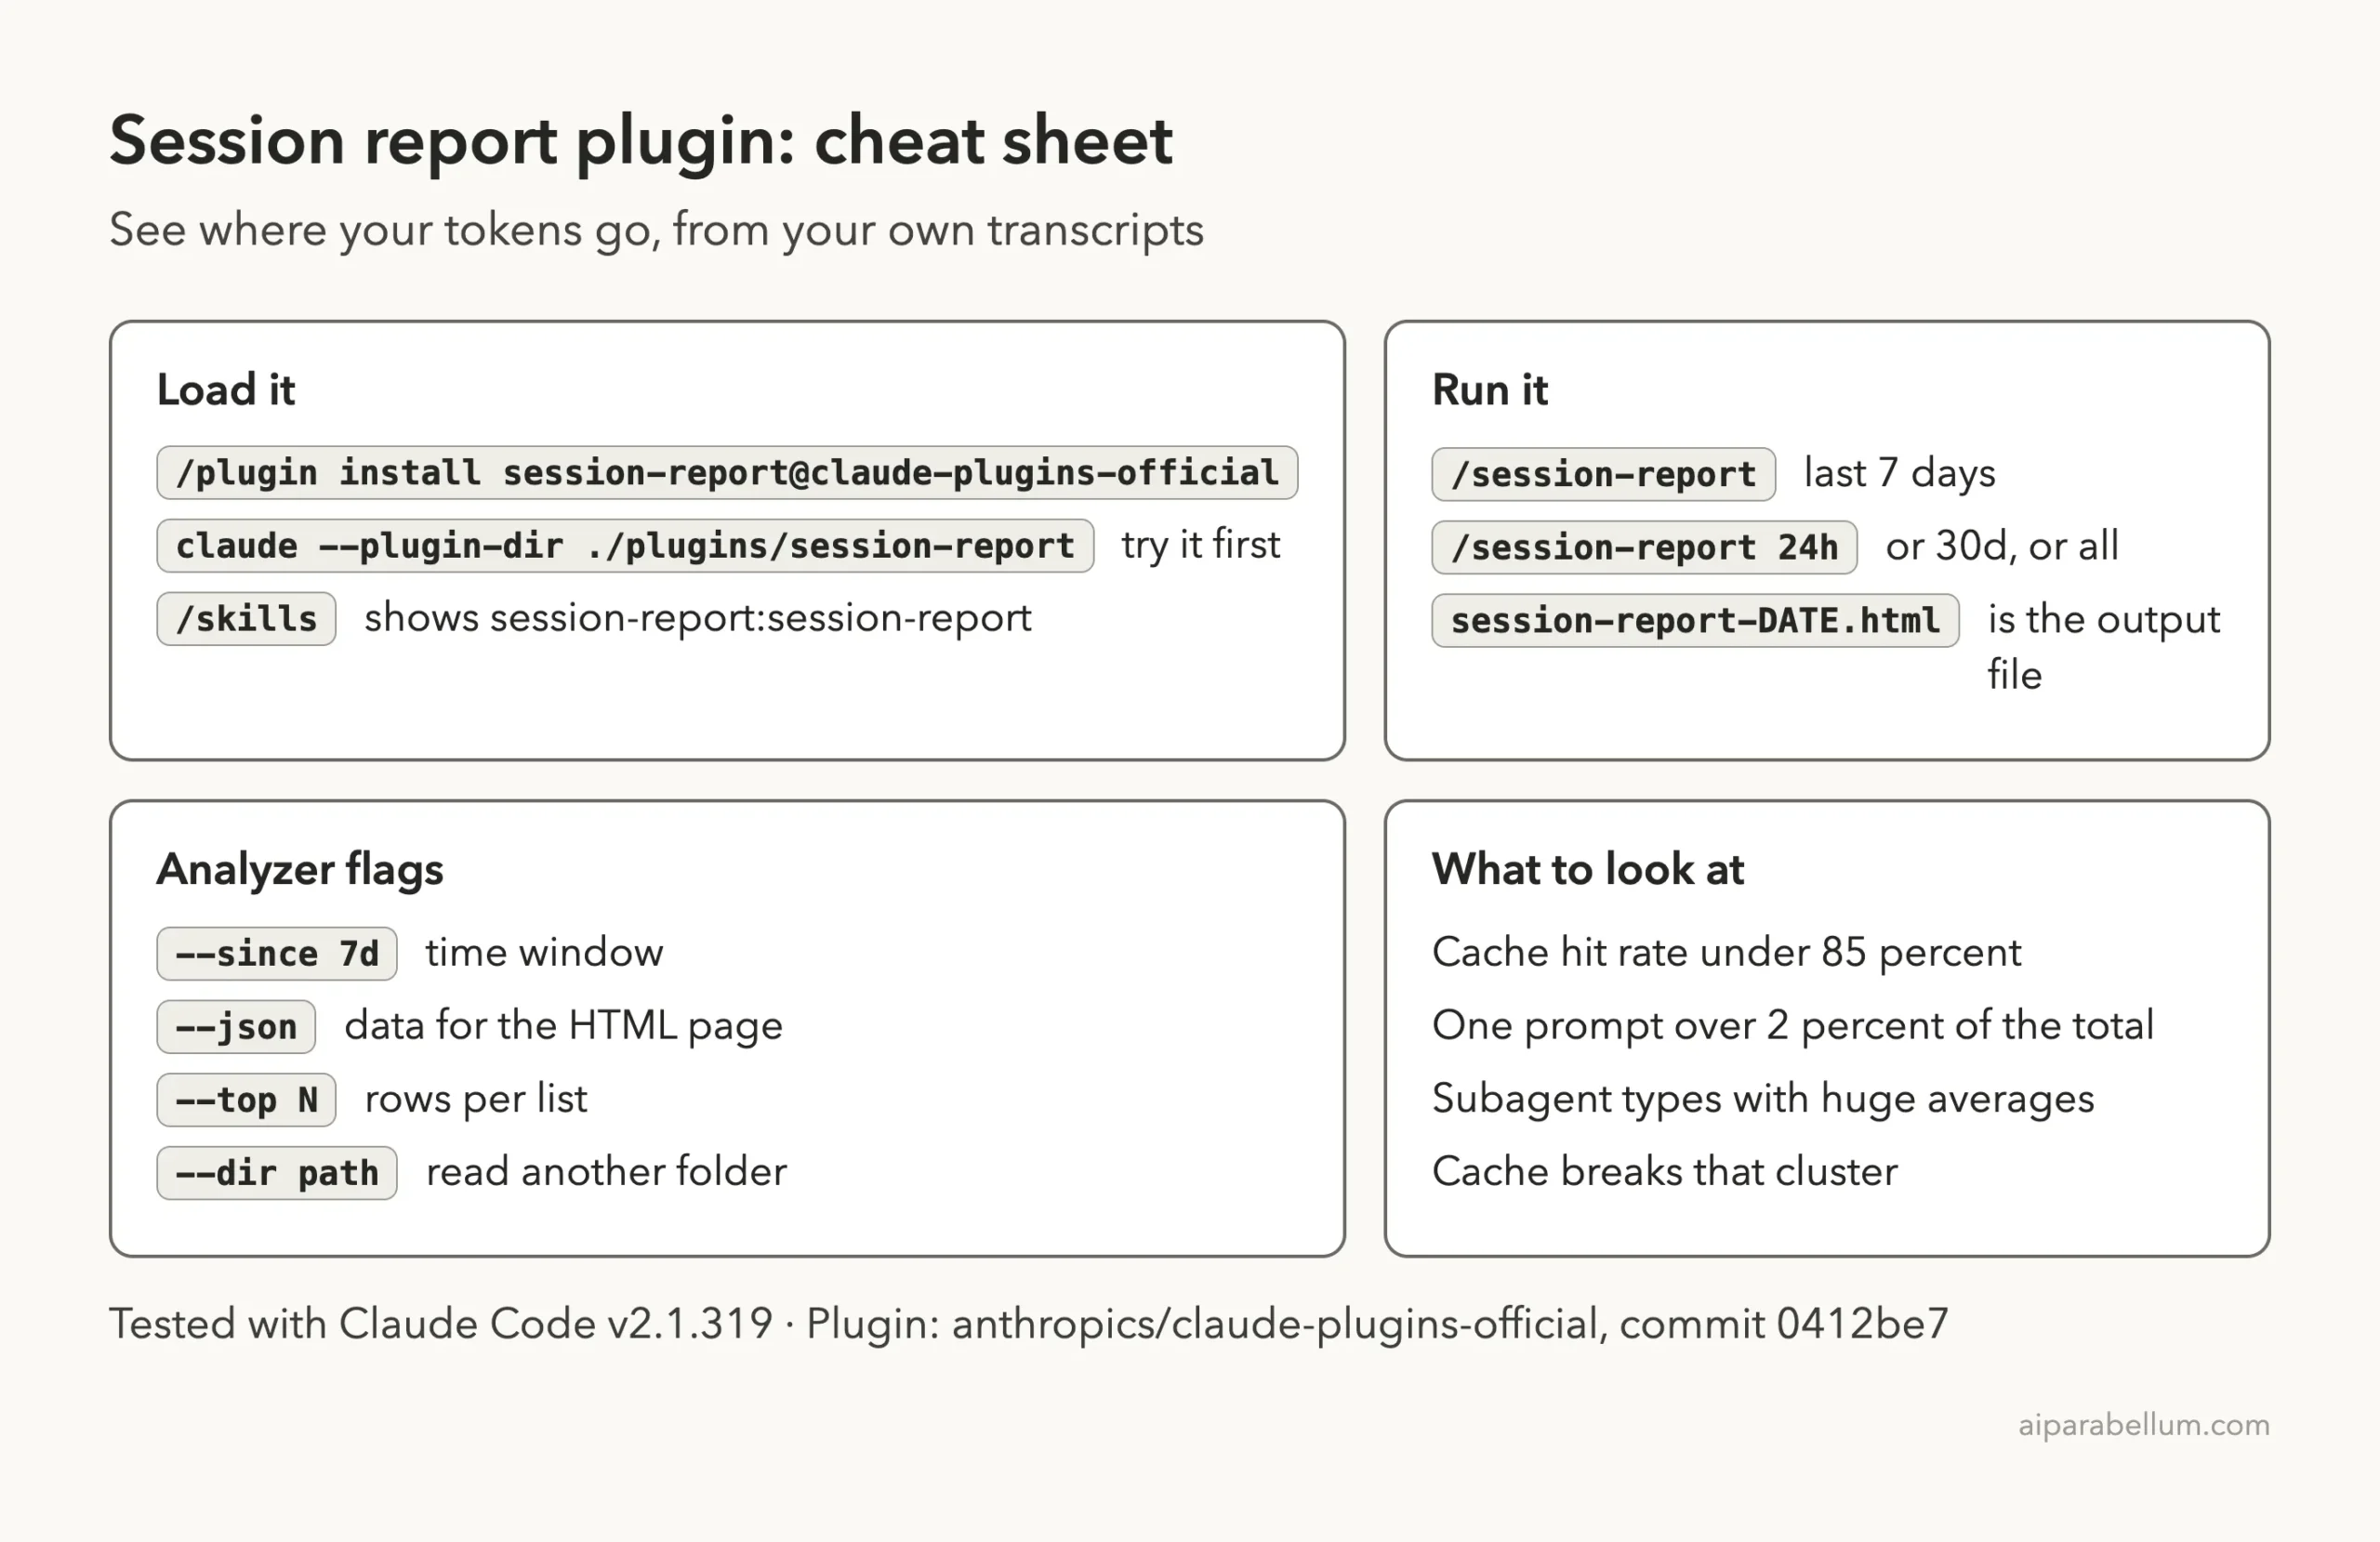
Cheat Sheet
Frequently Asked Questions
Is the Claude Code session report plugin free?
Yes. It is in Anthropic’s official marketplace and needs no account or key. Running the skill uses a little of your normal Claude Code usage, because Claude writes the findings.
Does the plugin send my transcripts anywhere?
The analyzer script we read only reads local files and prints results. The report page loads one web font, and nothing else, when you open it.
Where does the report get saved?
The skill copies the template into your current folder with a name like session-report- plus the date and time. It does not open the page for you.
Can I look at more than 7 days?
Yes. The skill says to honor a different range such as 24h, 30d or all. For all time, the script runs without the --since flag.
Can I use it on Windows or Linux?
The plugin is plain files plus a Node script, so it should work there. We tested on macOS, and the install steps for Windows and Linux follow Anthropic’s official instructions. Our Claude guide covers the wider product.
Conclusion
The Claude Code session report plugin is a small, safe add-on that turns your transcripts into a clear picture of where your tokens go. In our demo, the analyzer counted six calls, a 95.5 percent cache hit rate and three near-equal prompts, and the page showed them well. Install it if you use Claude Code daily and want to find your costliest habits, but read the report before you share it. Our test was a small demo, so judge the findings on your own real week.