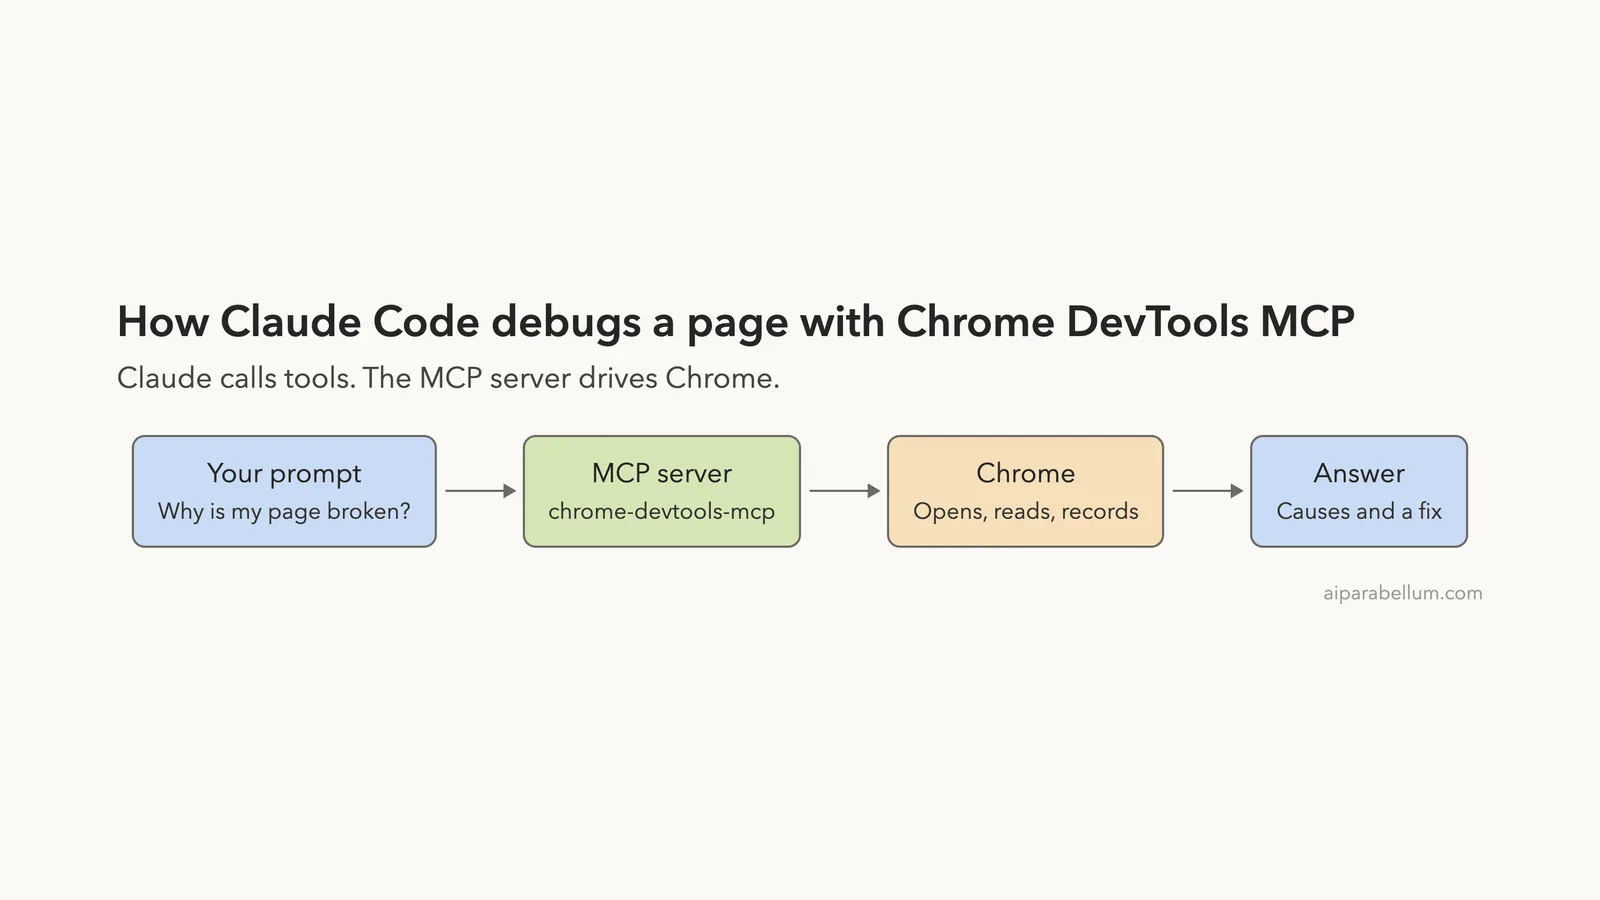
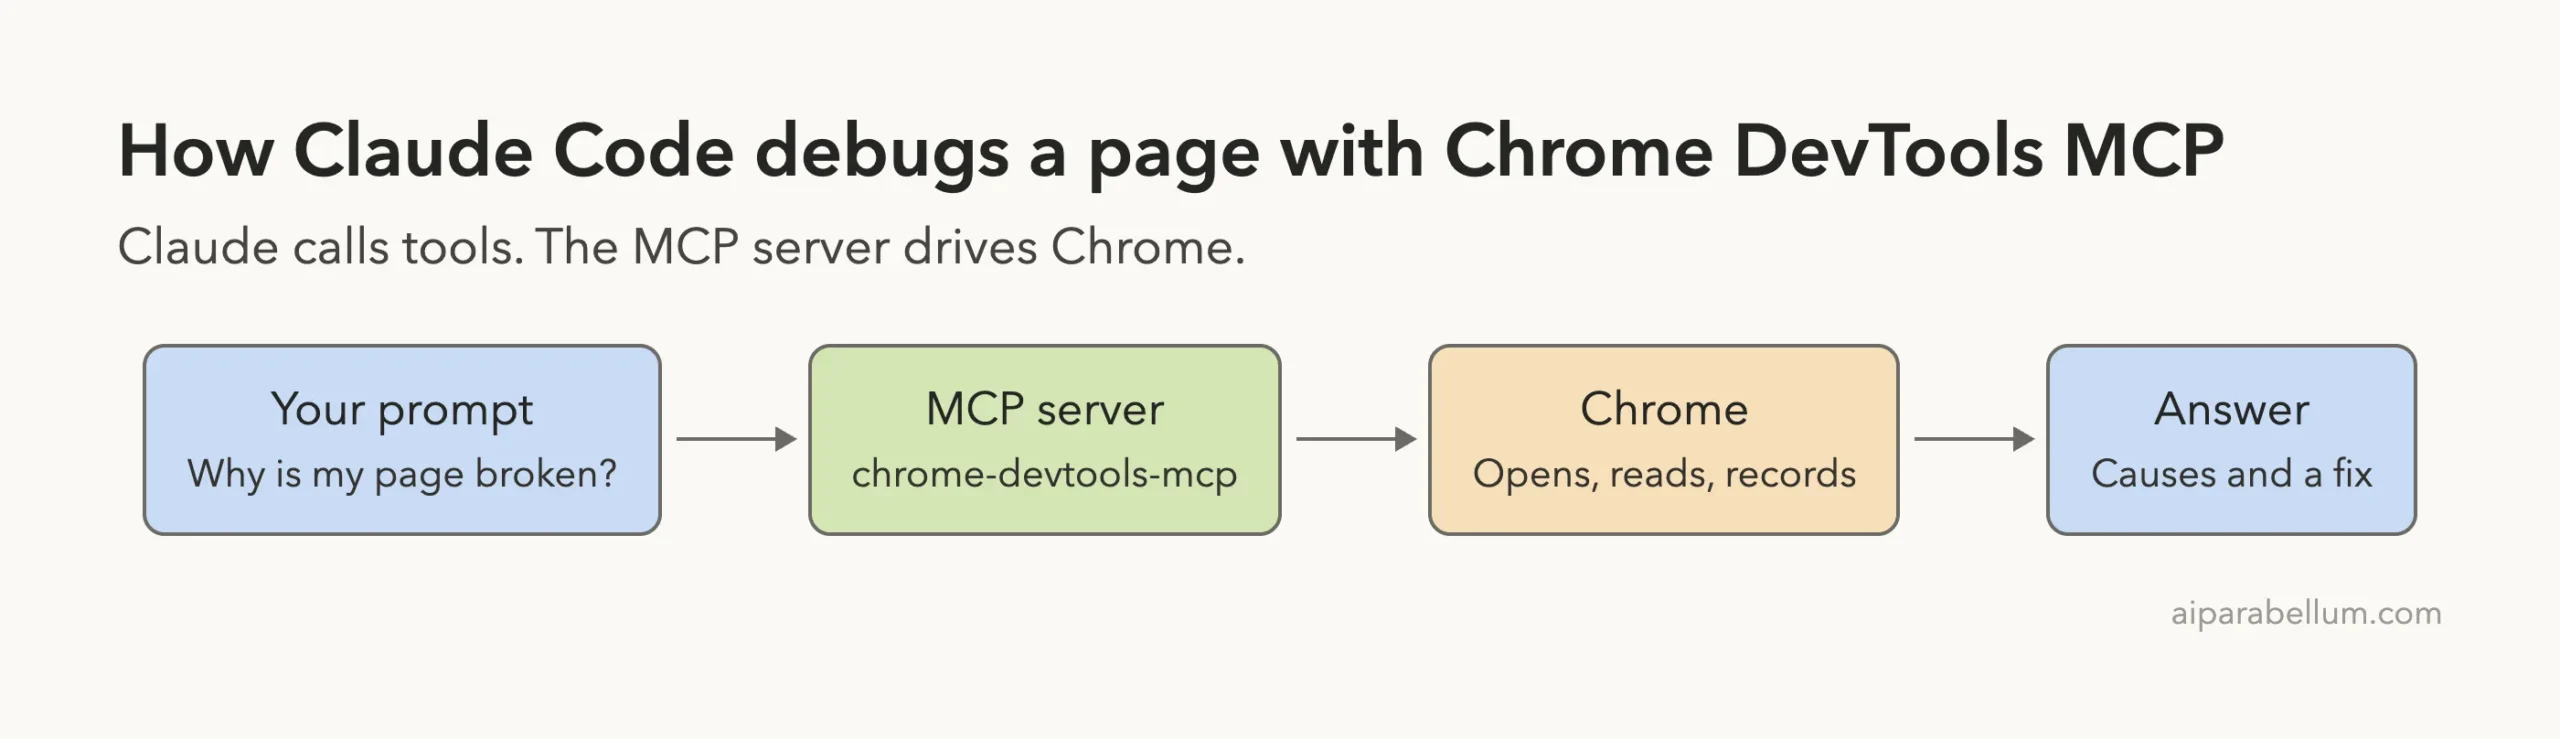
Chrome DevTools MCP for Claude Code lets Claude open a real Chrome browser, read the console, inspect network requests, take screenshots and record a speed trace. Instead of copying error messages from DevTools into your chat, you ask Claude to look at the page itself. We connected it to a throwaway project, gave Claude a broken coffee-shop page, and watched it find the bugs, fix them and prove the fix.
This guide is part of our Claude Code tutorials. Find more add-ons in our Skills Directory.
Tested with Claude Code v2.1.318 on November 6, 2026, using chrome-devtools-mcp version 1.12.0 (repo commit e3eb901, November 5, 2026). Everything ran in a sandbox folder with --setting-sources project and a clean, temporary Chrome profile, so nothing was added to the global Claude Code setup.
Quick Summary
| Question | Answer |
|---|---|
| What is it? | An MCP server that gives Claude control of a live Chrome browser and the DevTools features |
| Who makes it? | The Chrome DevTools team, in the ChromeDevTools/chrome-devtools-mcp repo |
| What it needs | Node.js and a current Chrome |
| What we tested | Console and network debugging, a performance trace, a code fix and a screenshot |
| Tools Claude saw | 32 tools in /mcp |
| Time it took | 11 seconds to find the causes, 15 seconds for the trace, 27 seconds to fix and verify |
| Biggest caution | The browser is fully open to Claude, so never point it at pages with private data |
What Chrome DevTools MCP Does
MCP stands for Model Context Protocol, a standard way to give Claude new tools. If MCP is new to you, our guide to Claude Code MCP explains the basics.
The Chrome DevTools server wraps the things you normally do by hand in the browser. According to the project’s README, it can record performance traces, analyze network requests, check console messages with source-mapped stack traces and take screenshots. It uses Puppeteer to click, type and navigate, and it waits for the page to settle after each action.
The tool reference groups the tools into a few families:
- Input automation, such as
click,fill,hoverandpress_key - Navigation, such as
navigate_page,new_pageandwait_for - Emulation, such as
emulateandresize_page - Performance, such as
performance_start_traceandperformance_analyze_insight - Network, such as
list_network_requests - Debugging, such as
evaluate_script
The browser does not start when the server connects. It starts the first time Claude uses a tool that needs a page.
How to Install Chrome DevTools MCP for Claude Code
The README gives a Claude Code plugin route. It installs the MCP server and a set of skills together. We did not run these two commands, because they would change the global setup:
/plugin marketplace add ChromeDevTools/chrome-devtools-mcp
/plugin install chrome-devtools-mcp@chrome-devtools-plugins
Our own Skills Directory lists the same plugin in the official marketplace, with the command /plugin install chrome-devtools-mcp@claude-plugins-official. Our guide to Claude Code plugins shows how marketplaces and installs work.
The plain MCP route is shorter. The README says to add this server to your MCP client:
{
  "mcpServers": {
    "chrome-devtools": {
      "command": "npx",
      "args": ["-y", "chrome-devtools-mcp@latest"]
    }
  }
}
The official MCP documentation covers how Claude Code reads MCP server settings. You can also check the project’s GitHub repository for newer instructions.
How We Set Up the Test Safely
We wanted a run that could not touch our real browser or setup. So we installed version 1.12.0 of the npm package into a sandbox folder and wrote a small mcp.json there. Then we started Claude Code with that file and nothing else:
claude --setting-sources project --mcp-config mcp.json --strict-mcp-configThe --strict-mcp-config flag tells Claude Code to use only the servers in that file. Our server arguments were these:
| Argument | Why we used it |
|---|---|
--headless | Runs Chrome without a visible window |
--isolated | Uses a temporary profile, so no saved logins or history are shared |
--no-usage-statistics | Opts out of Google’s usage statistics, which are on by default |
--no-performance-crux | Stops trace URLs going to the Chrome User Experience Report API |
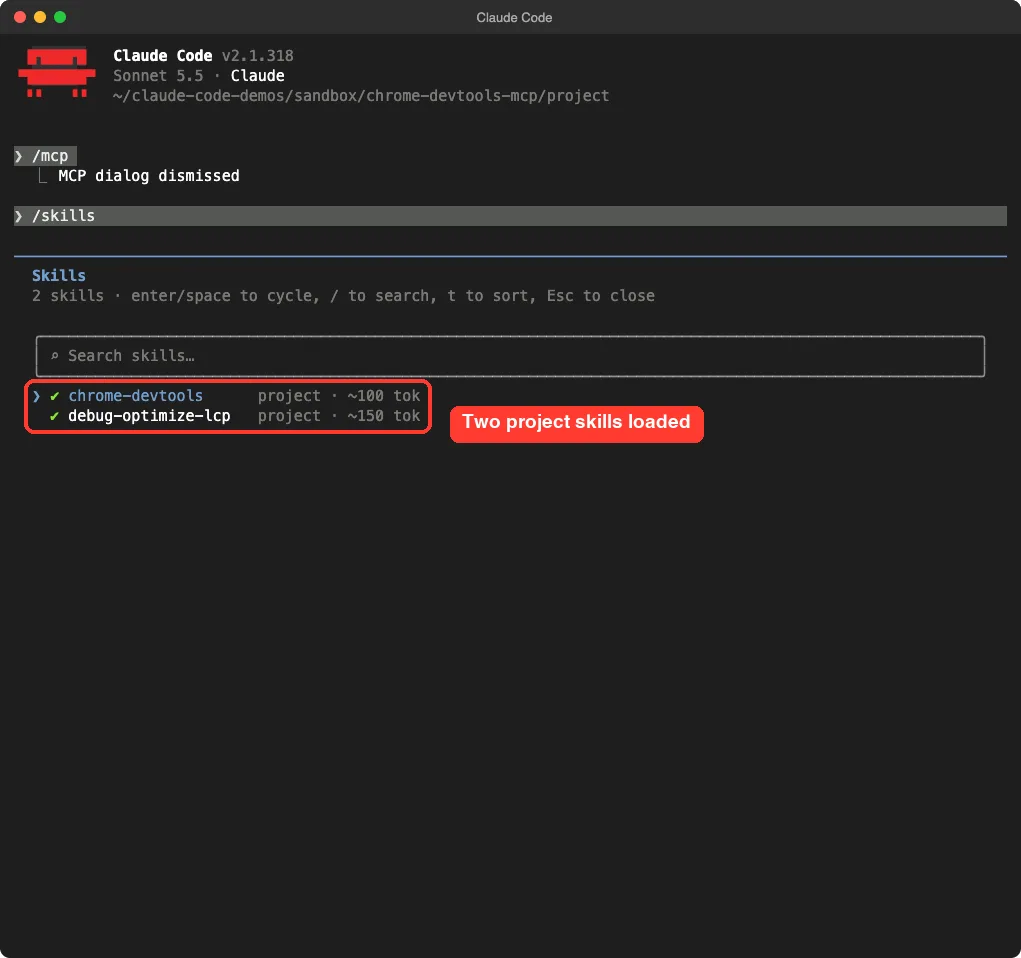
We also copied two of the project’s skills, chrome-devtools and debug-optimize-lcp, into the demo project’s .claude/skills/ folder. The repo ships seven skills in total, including accessibility, cookie and memory-leak debugging. We only used the two we needed.
Before we ran anything, we read the repo for hooks and found none. The plugin’s server entry simply runs npx with the pinned package version.
Step 1: Check That Claude Code Sees the Server
Run /mcp inside Claude Code. You should see chrome-devtools in the list with a green check and a tool count. Ours showed 32 tools.
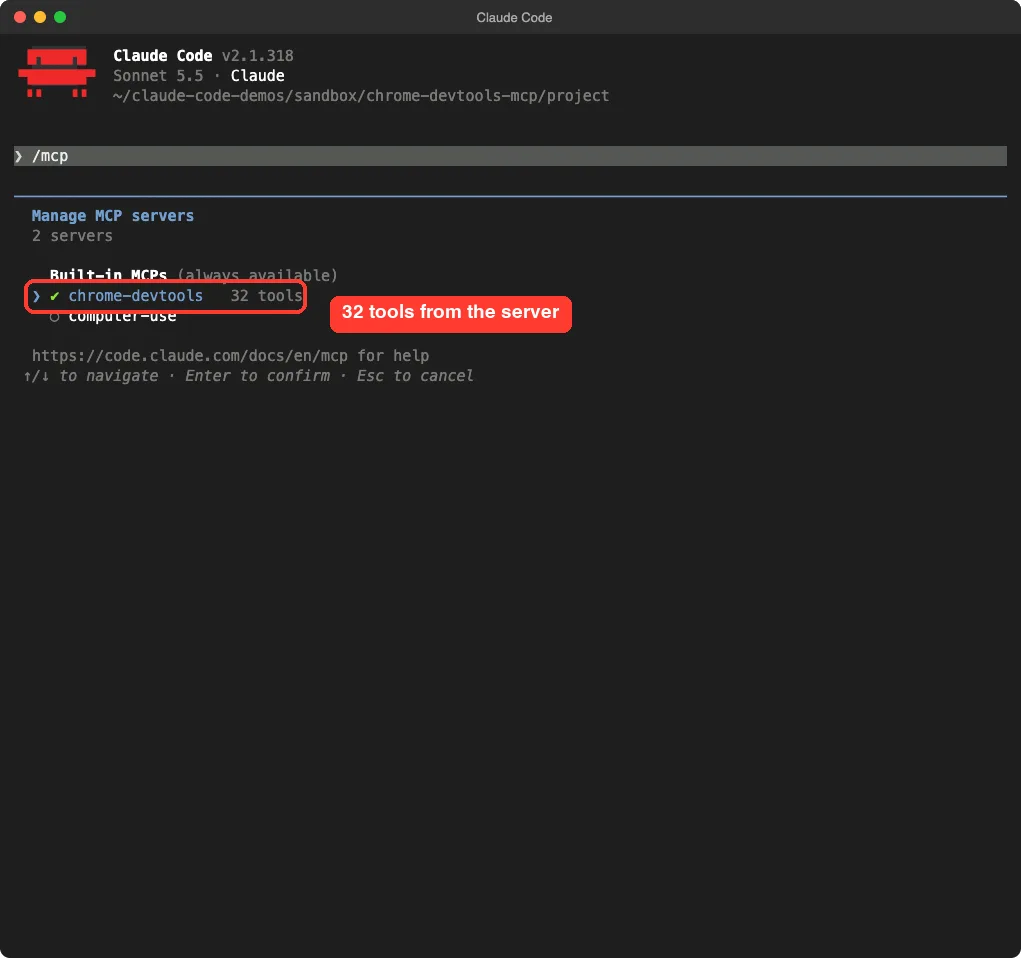
/mcp screen shows the Chrome DevTools server connected with 32 toolsThen run /skills to confirm the skills loaded. Ours listed both project skills, with token costs of about 100 and 150 tokens each.
Step 2: Debug a Broken Page in One Prompt
Our demo page is a tiny coffee-shop site served from a local folder. We planted two bugs on purpose. The menu data comes from a file that does not exist, and the script reads a setting that was never defined. This was the prompt:
Open http://127.0.0.1:8765/ in the browser. The menu never loads. Check the console messages and network requests, take a screenshot, and tell me the two causes in two short sentences. Do not edit any files.Claude called the browser tools four times and answered in 11 seconds.
It found that app.js requests /api/menu.json, which returns a 404, and that the 404 page is HTML, so parsing it as JSON fails. It also found a separate TypeError from the missing shopName setting. It added that the favicon.ico 404 was harmless noise.
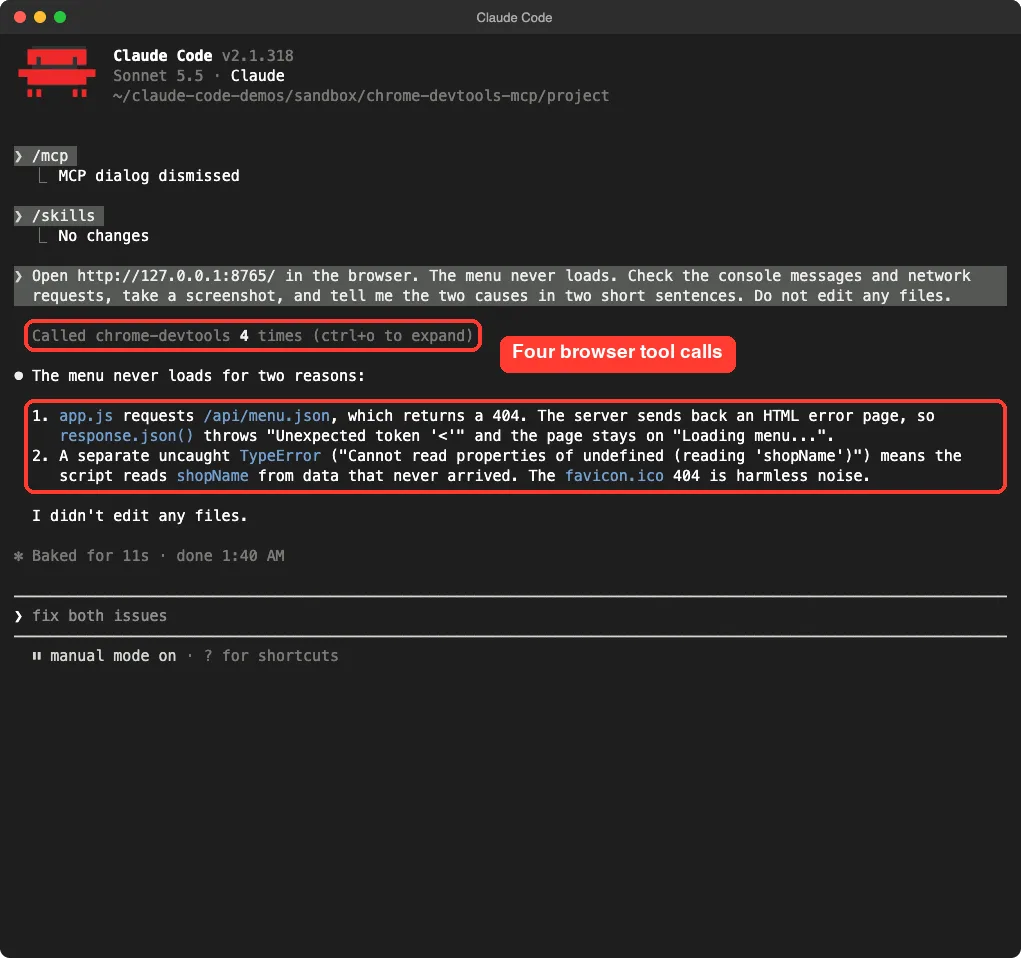
This is the part that saves time. You never opened DevTools, never copied a stack trace, and never described the network tab to Claude. It looked for itself.
Step 3: Measure Speed With a Performance Trace
Next we asked for a performance trace with a page reload. We asked for three short bullets and told Claude not to edit files.
Record a performance trace of http://127.0.0.1:8765/ with a page reload. Summarize the LCP value and the top insight in 3 short bullets. Do not edit files.LCP means Largest Contentful Paint, the time until the biggest visible item appears. Claude made two tool calls and reported these numbers from the trace:
| Measure | Result in our run |
|---|---|
| LCP | 235 ms, under the 2.5 second threshold Claude cited as good |
| CLS (layout shift) | 0.00 |
| Render delay | 234 ms of the LCP |
| Time to first byte | 0.7 ms |
| Real-user data | None available for this local page |
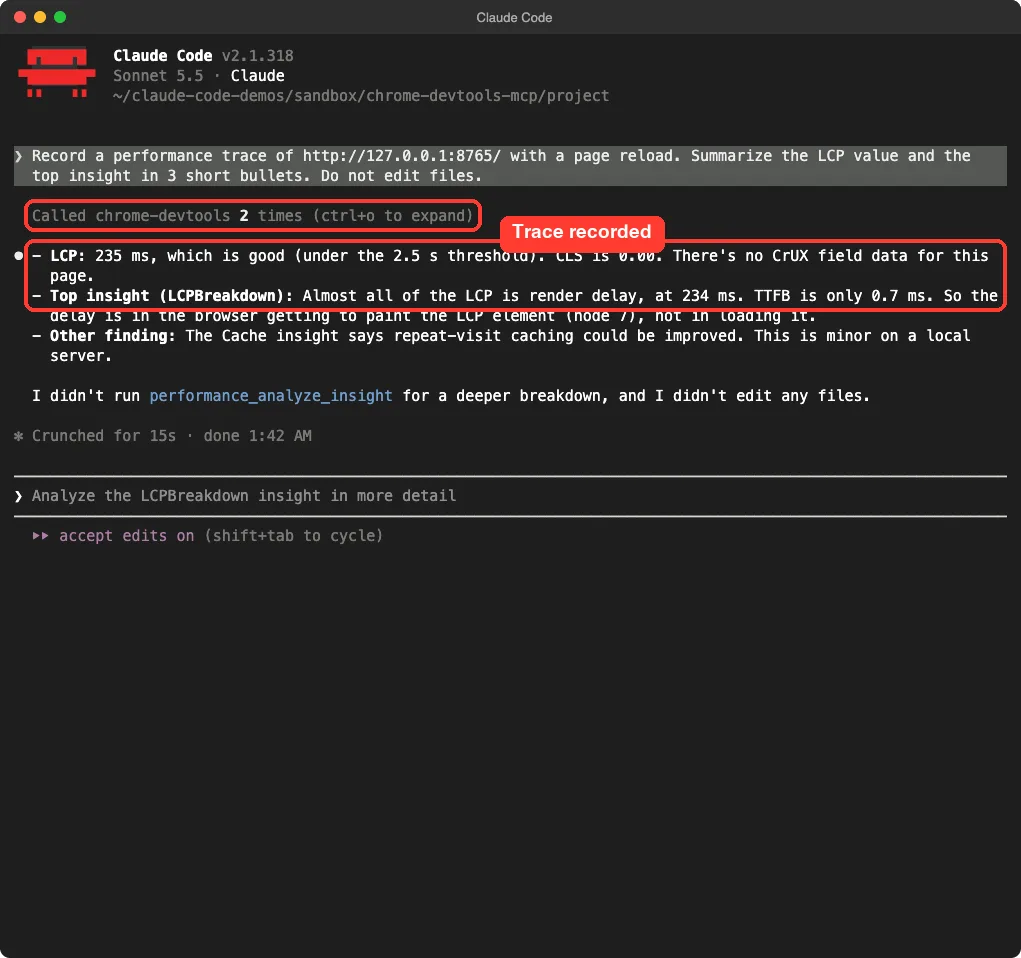
Treat these numbers as a demo, not a benchmark. Our page was a few tiny files on a local server, so speed was never going to be a problem.
The point is that Claude can record a trace, read the insights and explain them in plain English. On a real, slow site the same prompt would be where you start.
The server can also send trace URLs to Google’s CrUX API to add real-user data next to the lab data. We turned that off with --no-performance-crux.
Step 4: Let Claude Fix the Bugs and Prove It
Now we switched Claude Code to accept-edits mode and asked for a fix plus proof:
Now fix both bugs inside the site folder (add the missing API file and define the missing config). Reload the page, confirm the console has no errors, and save a screenshot to site-after.png in this folder.Claude added site/api/menu.json with three sample drinks, added site/config.js and loaded it before app.js. After a reload it saw one more 404, for favicon.ico, and added an inline favicon line to index.html. Claude told us plainly that this went beyond the two bugs we named, which we liked.
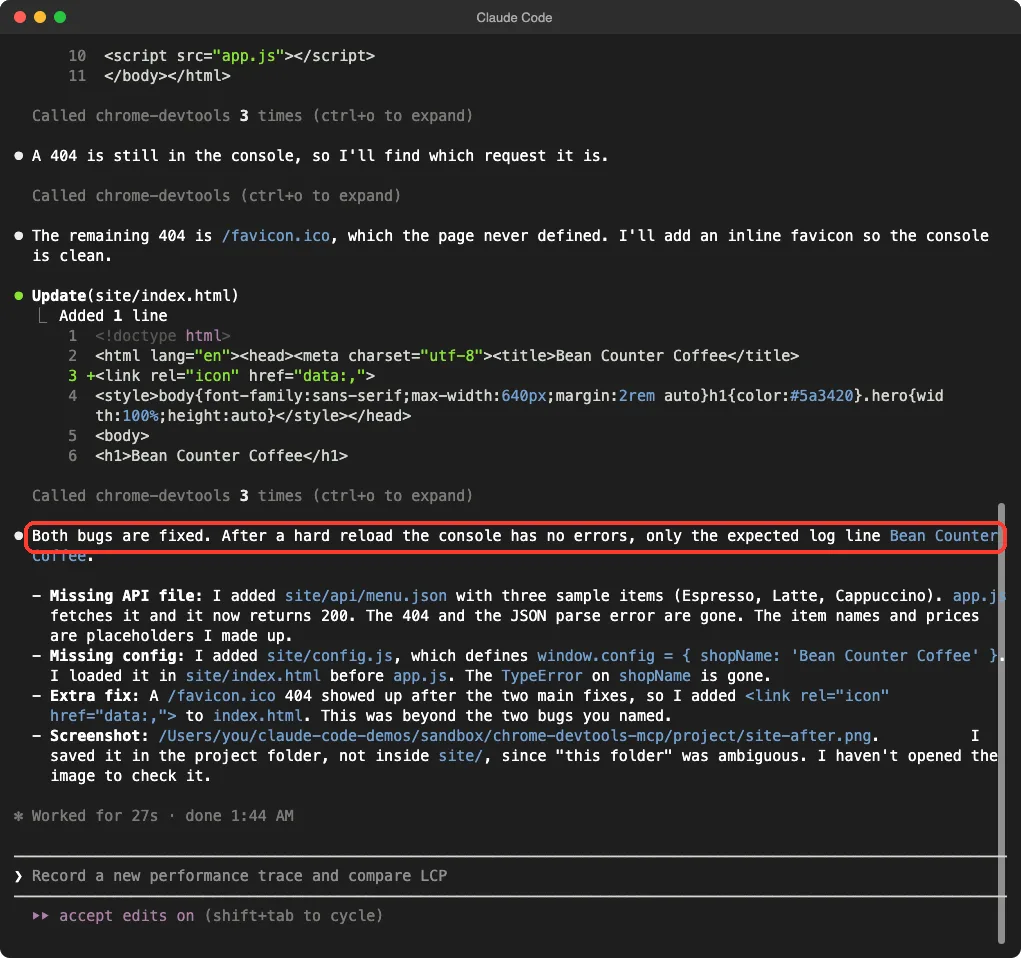
The sample item names and prices were placeholders Claude made up, and it said so. It also said it had not opened the screenshot to check it. We opened it ourselves, and here is the real page it captured:
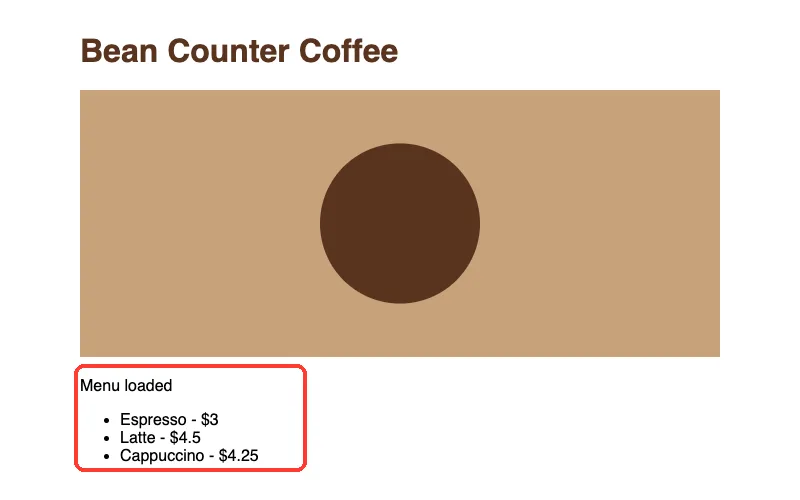
One small note: Claude saved the screenshot in the project folder, not inside site/, because our wording of “this folder” was ambiguous. Be specific about paths.
Which Tool Answers Which Question
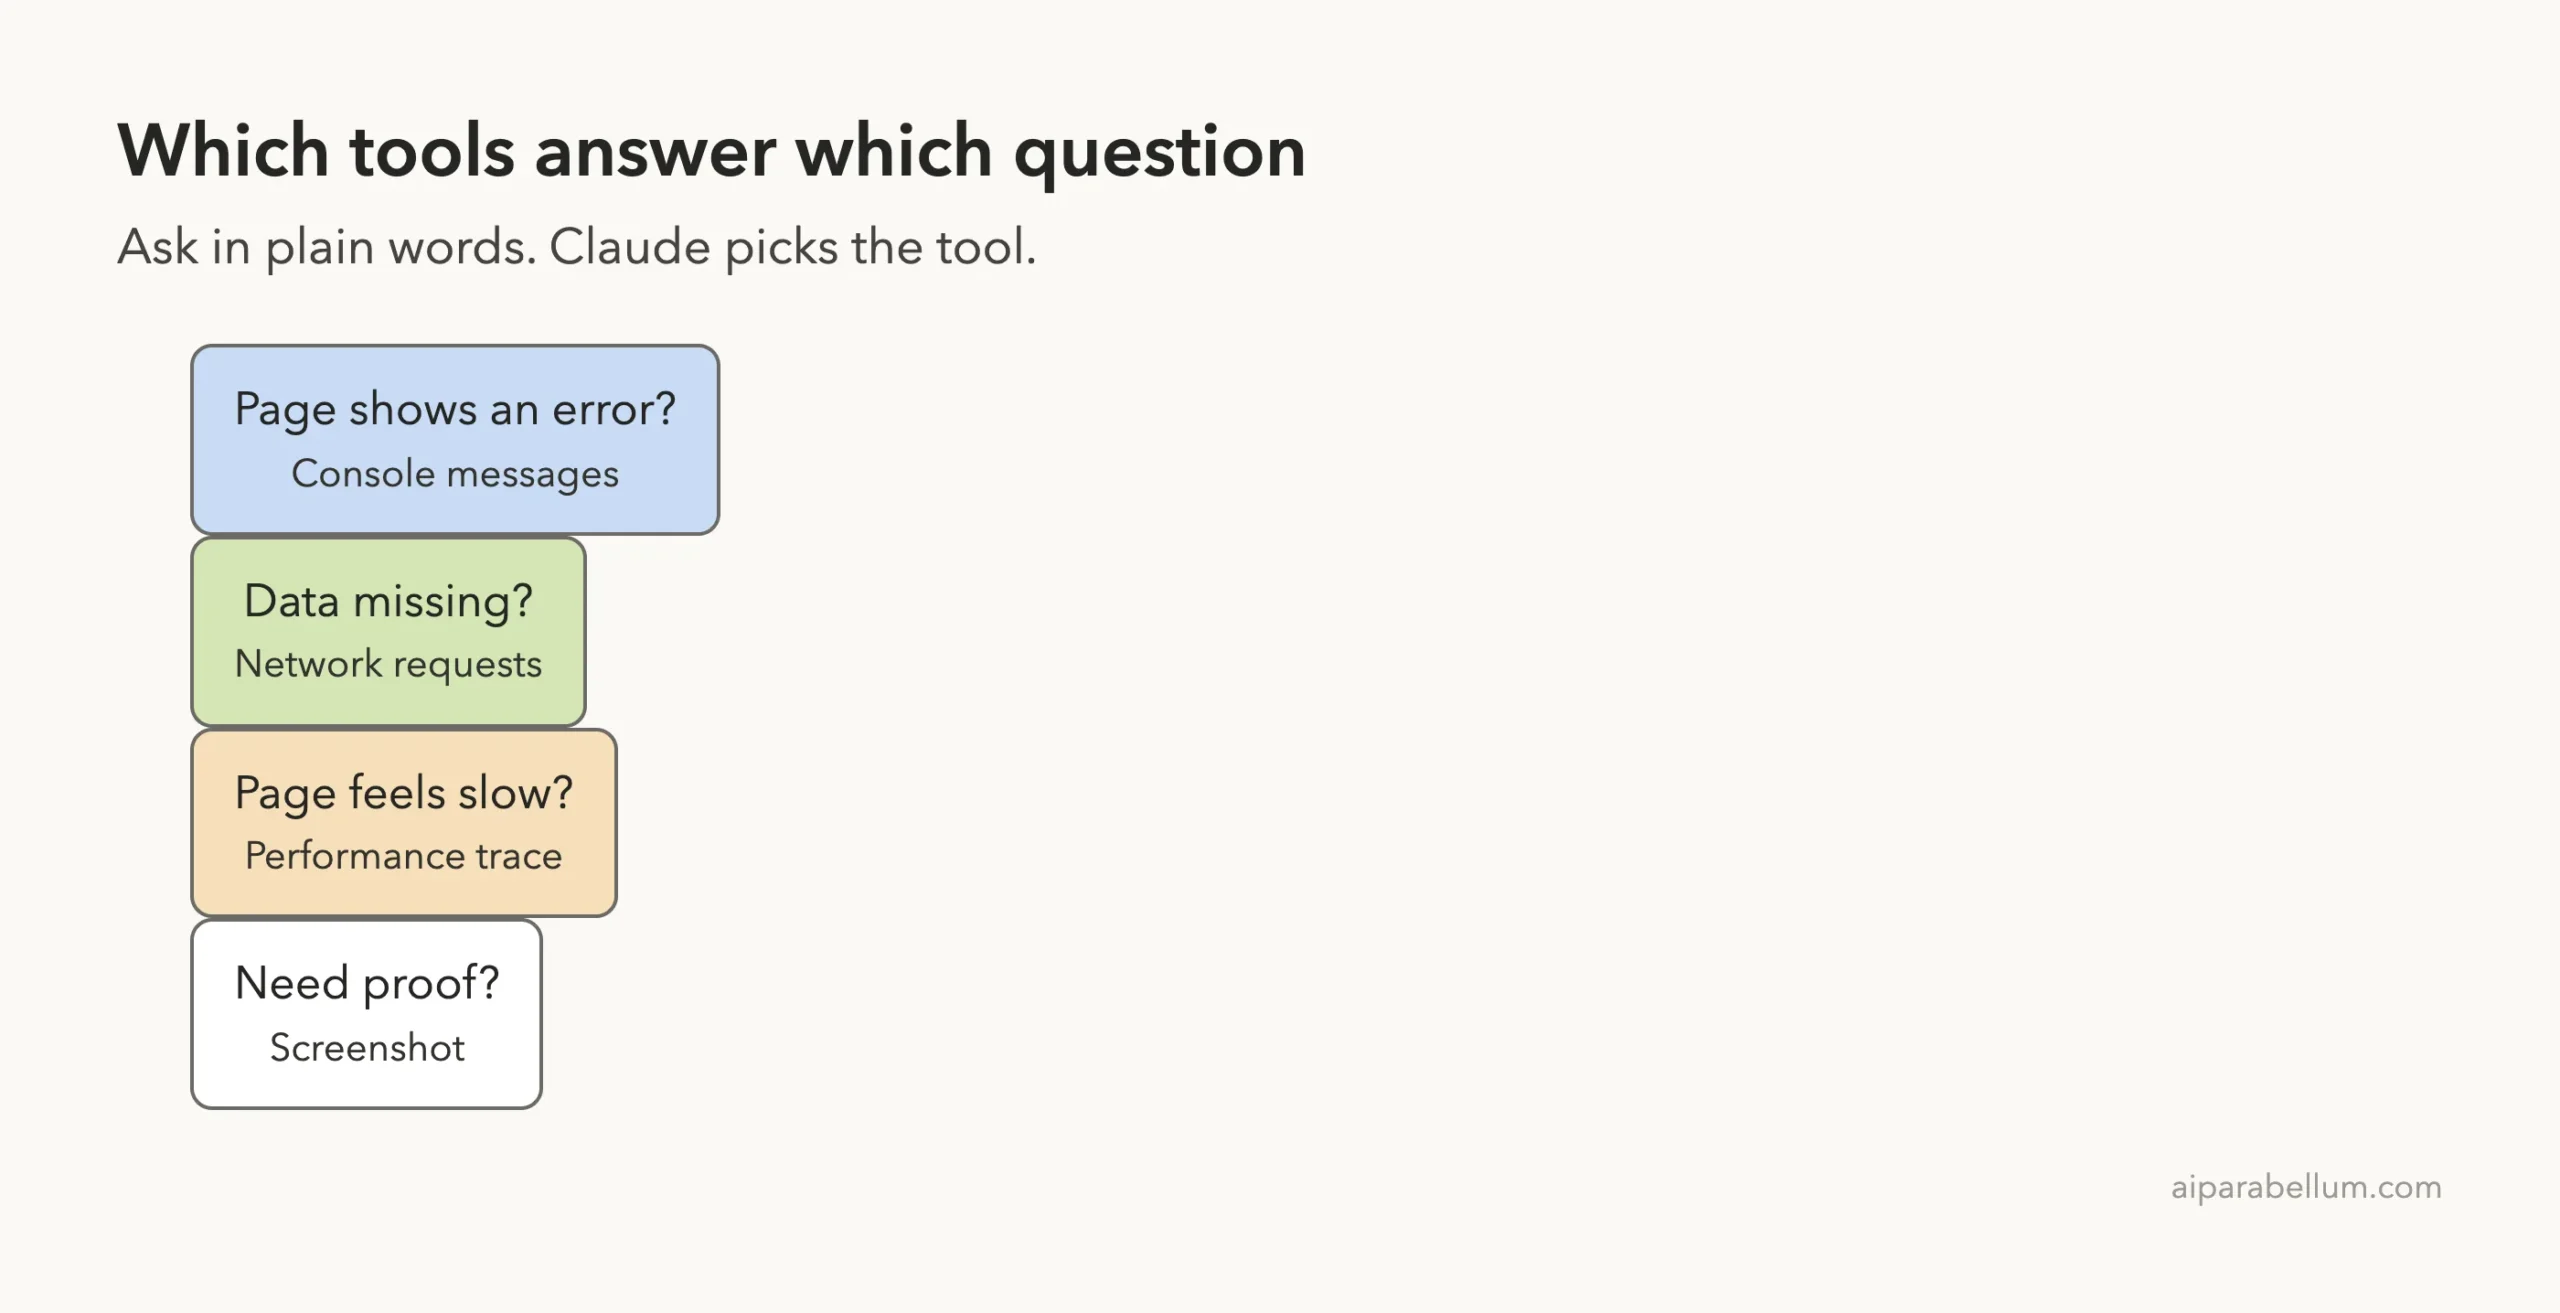
You do not need to name tools in your prompts. Describe the symptom, and Claude chooses. This ladder shows how we think about it:
What We Could Not Test
Honest limits matter here. We ran the server headless against a local page only.
We did not test it against a logged-in site, a real production page, device emulation, accessibility audits or the memory-leak tools. Those come from the README and tool reference, not from our run.
We also did not run the plugin install commands, so we cannot say how the one-step plugin experience feels. We loaded the same server and two skills by hand.
Safety: Who Can See What
The README is direct about the risk. The server exposes the content of the browser to the MCP client, so it can inspect and modify any data in the browser or in DevTools. If you attach it to your everyday Chrome profile, Claude can see everything that profile can see.
Our advice is simple:
- Use
--isolatedso each session starts with a fresh, temporary profile - Use
--headlesswhen you do not need to watch - Do not sign in to personal accounts in that browser
- Opt out of usage statistics and CrUX lookups if your team requires it
- Remember the server also checks the npm registry for updates unless you set
CHROME_DEVTOOLS_MCP_NO_UPDATE_CHECKS
Try It Yourself
Make a tiny folder with an index.html and a script that calls a missing file. Serve it with python3 -m http.server 8765 from that folder, then start Claude Code with the Chrome DevTools server connected. Paste this prompt:
Open http://127.0.0.1:8765/ in the browser. Check the console messages and network requests. Tell me what is broken and why. Do not edit any files.Then ask for a fix and a screenshot as in step four. Compare Claude’s answer to what you see yourself in Chrome DevTools.
Common Mistakes
- Pointing the server at your daily Chrome profile instead of an isolated one
- Forgetting that the server needs Node.js and a current Chrome
- Asking for a fix without saying which folder to edit
- Trusting the speed numbers from a local server as if they were real-world results
- Trusting a saved screenshot without opening it
Pro Tips
- Say “Do not edit any files” when you only want a diagnosis
- Ask for the console and the network together, since one bug often causes the other
- Ask Claude to reload and re-check after every fix
- Pin the package version, as the plugin does, so a new release does not change behavior mid-project
- Run
/mcpfirst whenever tools seem missing
Let Claude look at the page itself, and keep the browser it uses clean.
Cheat Sheet
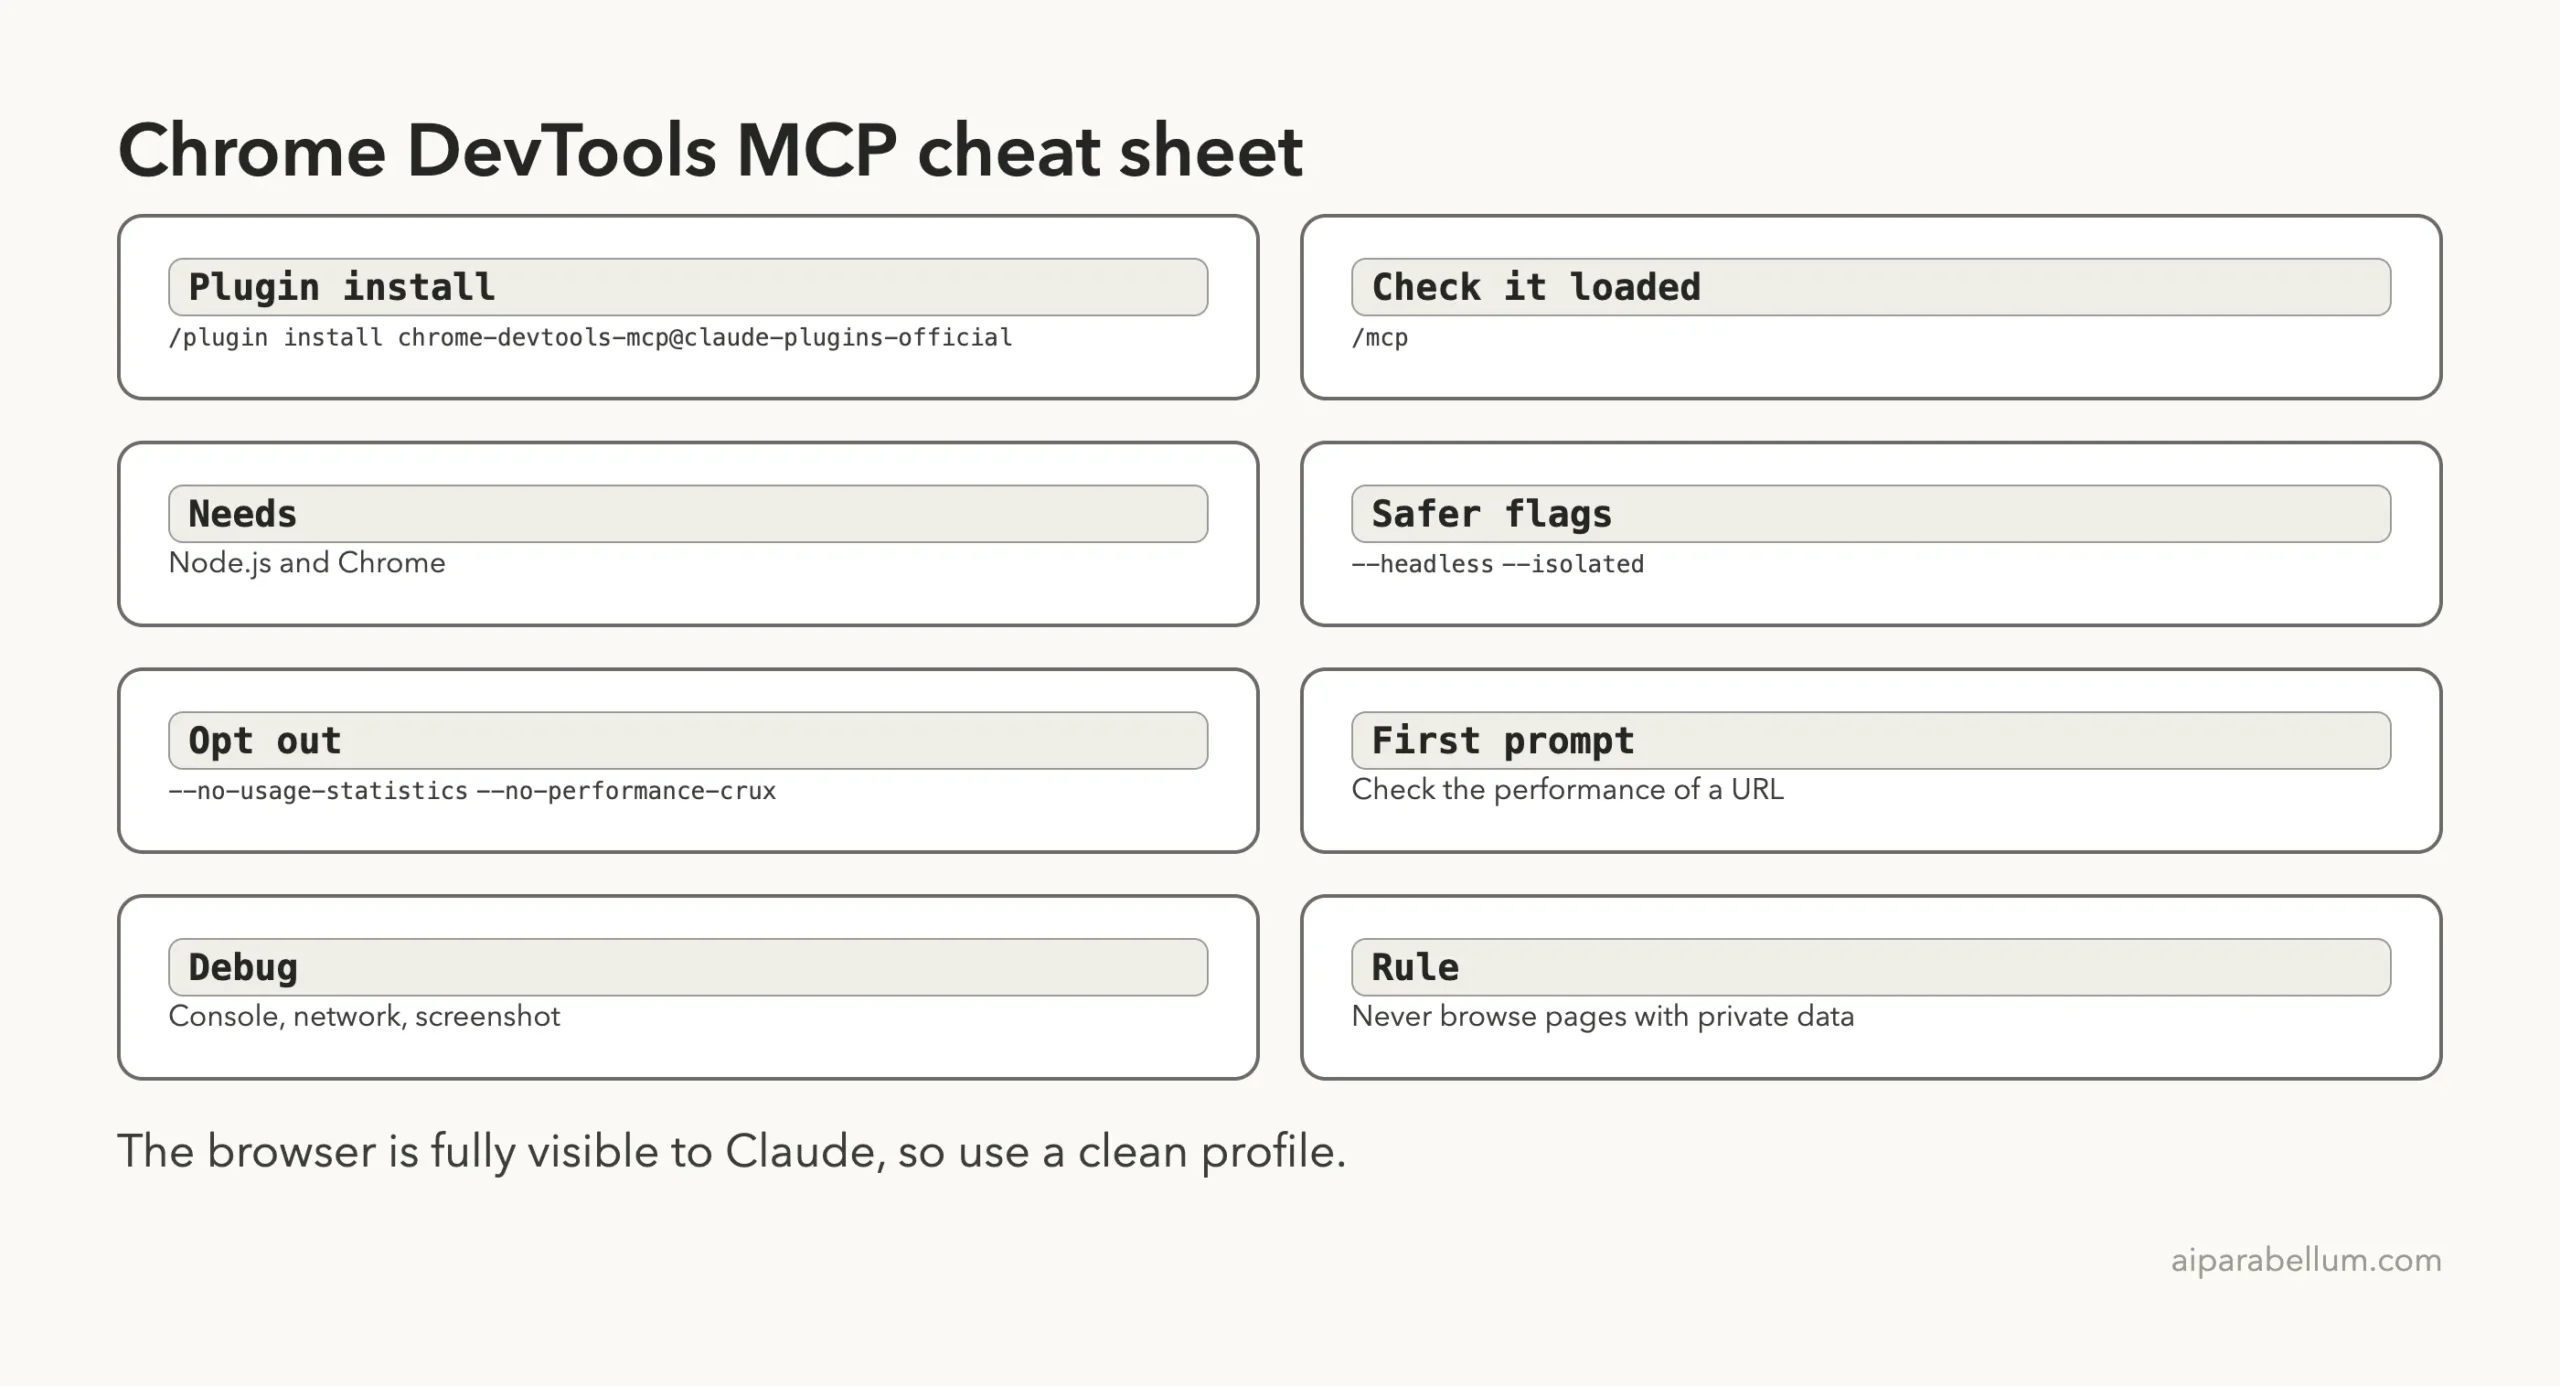
Our Verdict
It works, and it works quickly. Claude found two real bugs, explained both, fixed them and showed a clean console in under a minute of its own time. The server is useful for front-end developers, for anyone who debugs web apps with Claude Code, and for people who want a quick speed check without learning every DevTools panel.
It is less suited to anyone who cannot isolate the browser from personal data. If that is you, stay with the headless and isolated settings, or skip it. For a broader look at add-ons like this one, browse our guide to Claude Code skills and the Claude AI overview.
Frequently Asked Questions
Does Chrome DevTools MCP work with Claude Code?
Yes. In our test on Claude Code v2.1.318, /mcp showed the server connected with 32 tools, and Claude used them to debug and measure a local page.
Do I need Chrome installed?
Yes. The README lists Node.js, npm and a current stable Chrome as requirements. It officially supports Google Chrome and Chrome for Testing only.
Will it use my normal Chrome profile and logins?
Not if you use --isolated, which gives it a temporary profile. Without that, the default is a persistent profile, so check the configuration docs before you rely on it.
Does it send my data to Google?
The README says usage statistics are on by default, and trace URLs may go to the CrUX API. You can turn these off with --no-usage-statistics and --no-performance-crux.
Can Claude fix the bugs it finds?
Yes, if you allow edits. In our run it fixed both planted bugs, and it also fixed a third small issue and told us about it.
Conclusion
Chrome DevTools MCP turns Claude Code into a debugging partner that can actually see your page. We connected it safely in a sandbox, found two bugs with one prompt, recorded a trace, fixed the code and checked the result with a screenshot. Keep the browser isolated, read the privacy flags before you start, and treat local speed numbers as practice. If you try it, start with a small demo page like ours and read more in the official plugins documentation.