Do you spend part of every Monday copying numbers into a report? You can automate reports with Claude Code so that the work happens once, and every later week takes a few seconds. We tested this with a made-up week of shop sales, and it worked in two short prompts.
You do not need to know how to program. You describe the report in plain English, Claude Code writes a small script, and you rerun that script whenever new numbers arrive.
This is Part 10 of 10 in our Claude Code for Non-Coders series, part of our Claude Code tutorials. Last time we covered finding duplicate files, and the same safety habit applies here: read what Claude proposes before you approve it.
Tested with Claude Code v2.1.312 on October 31, 2026, on macOS. We tested on macOS; the Windows and Linux steps follow Anthropic’s official instructions.
What We Built in This Tutorial
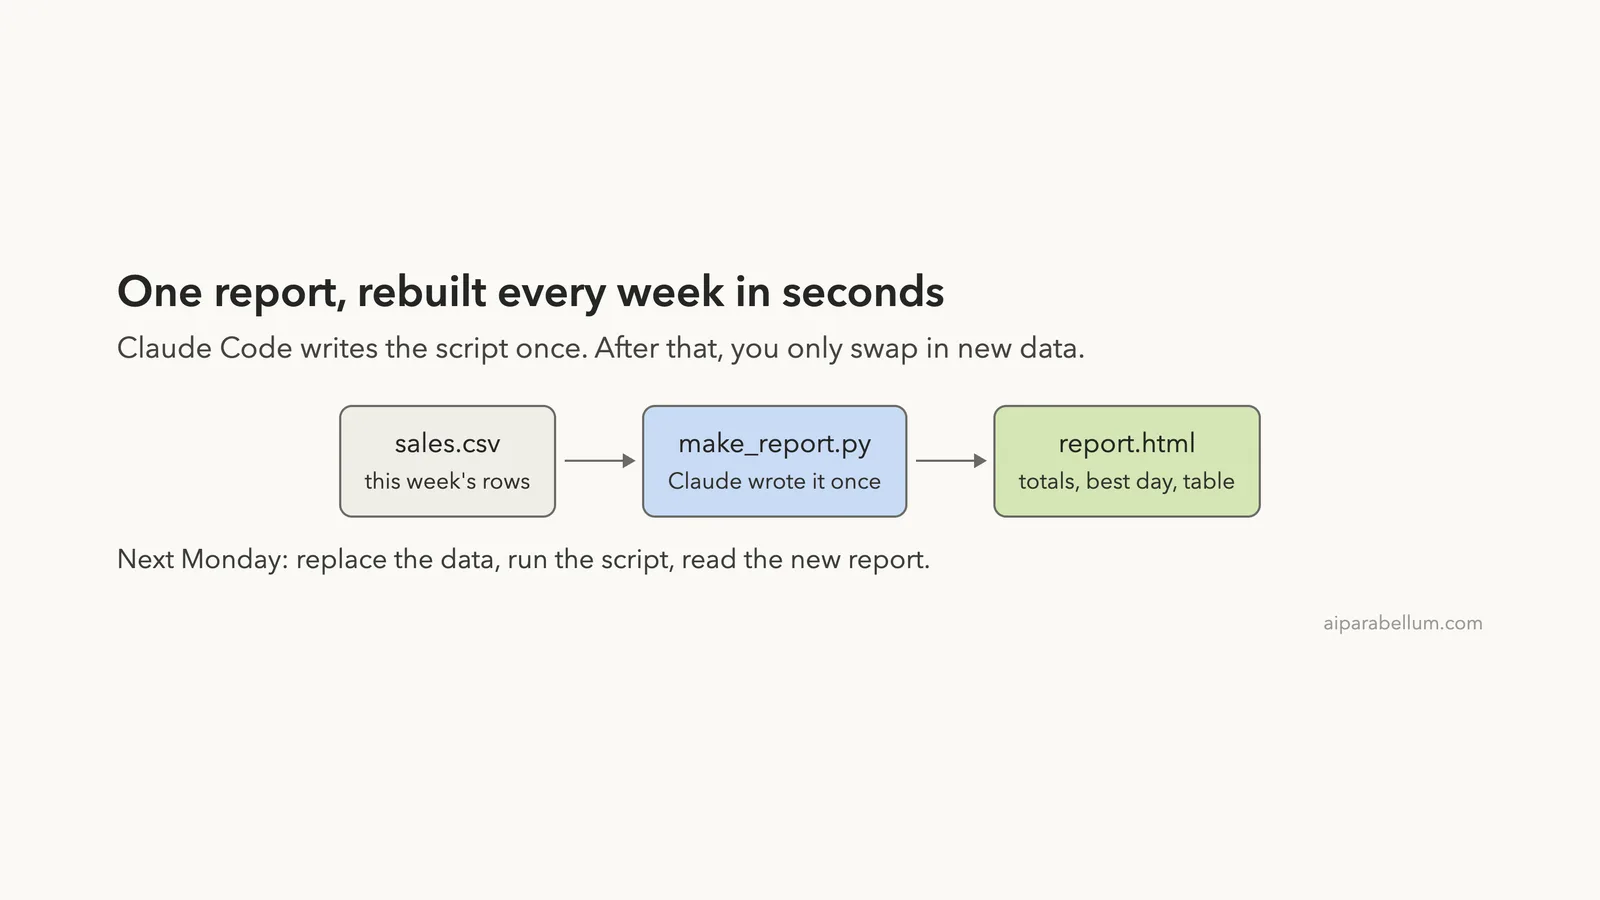
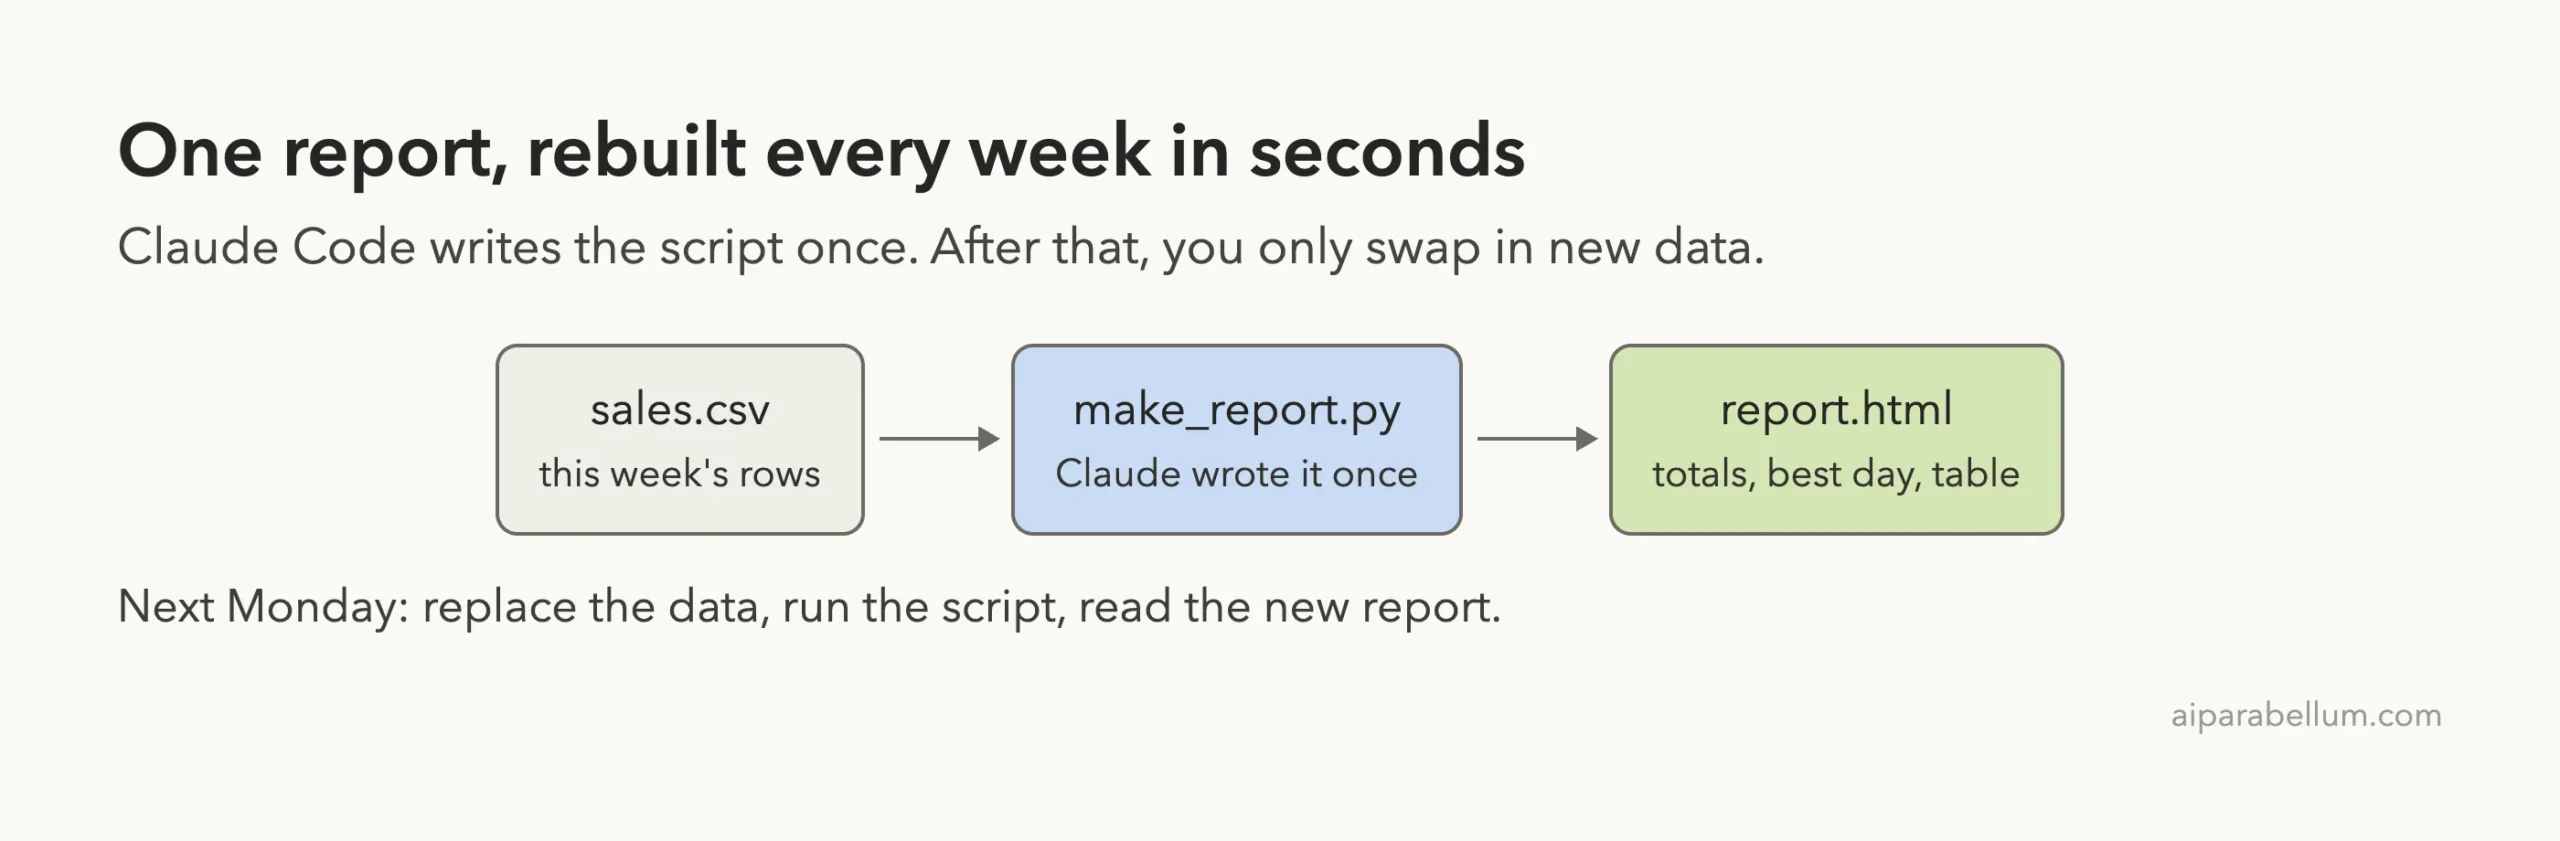
A weekly report is just the same steps repeated, so let Claude write the steps once and let a script repeat them.
| Item | Details |
|---|---|
| Goal | Turn a weekly sales spreadsheet into a one-page report |
| Starting point | A made-up file called sales.csv with 28 rows: 7 days, 4 products |
| Result | A script called make_report.py that writes report.html |
| Report contents | Total revenue, best day, a table by product, and a comparison with last week |
| Typed prompts | 2 prompts, plus a few Enter presses to approve steps |
| Installed for this | Nothing extra. Claude used Python, which was already on the Mac |
Everything in the demo is invented. The products, prices and sales numbers were made up for this test, and no real business data was used.
Why Automate Reports With Claude Code
Most weekly reports follow the same recipe. You open a spreadsheet, add up a few columns, find the biggest number, and paste the results into a document.
That recipe is easy for a computer to repeat, but only if someone writes it down as a script. Claude Code is good at writing that script for you, because you can explain the report the way you would explain it to a coworker.
The important idea is that Claude writes the script once. After that, you can run it yourself without Claude, and it gives the same kind of report every time.
Script Versus Asking Claude Every Week
You could ask Claude Code to build the report from scratch each week. That works, but it costs time and a little usage each time, and the layout may change slightly.
A saved script does the same job in a second, and the numbers are calculated the same way every week. Use Claude for the first version and for changes, and use the script for the weekly routine.
What a Report Like This Can and Cannot Do
It adds up numbers, finds a best day, and compares two weeks. It does not know why sales went up or down, so the thinking stays with you.
Before You Start: A Practice Folder
Use a practice folder, not your real accounting files. Claude Code can create and change files when you approve it, so a test folder keeps real data safe while you learn.
- Create a folder, for example
weekly-report. - Put a small spreadsheet saved as CSV inside it. A CSV file is a plain table that Excel, Numbers and Google Sheets can all export.
- Open a terminal in that folder and type
claude. - Read the trust question and choose yes only for your own practice folder.
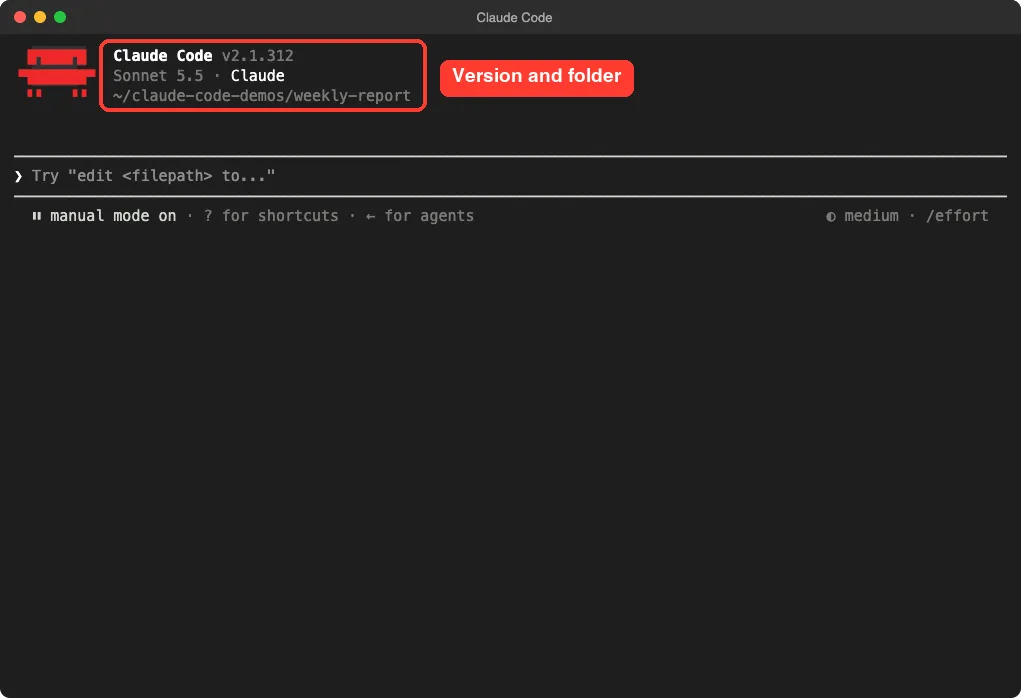
Our file had four columns: date, product, units and price. If you have not used Claude Code before, our first session guide walks through the start screen.
Step 1: Describe the Report You Want to Automate
Our first prompt told Claude what the file contains, what the report should show, and what to do next. Being specific about the contents saves a round of corrections.
Read sales.csv. It has one week of made-up shop sales (date, product, units, price). Write a small Python script called make_report.py that reads sales.csv and writes a one-page report.html with: total revenue, the best day, and a table of units and revenue per product. Then run it.Notice the three parts: the input file, the output you want, and the instruction to run it. You can swap in your own columns and your own measures, such as average order size or the slowest day.
Approve the New File
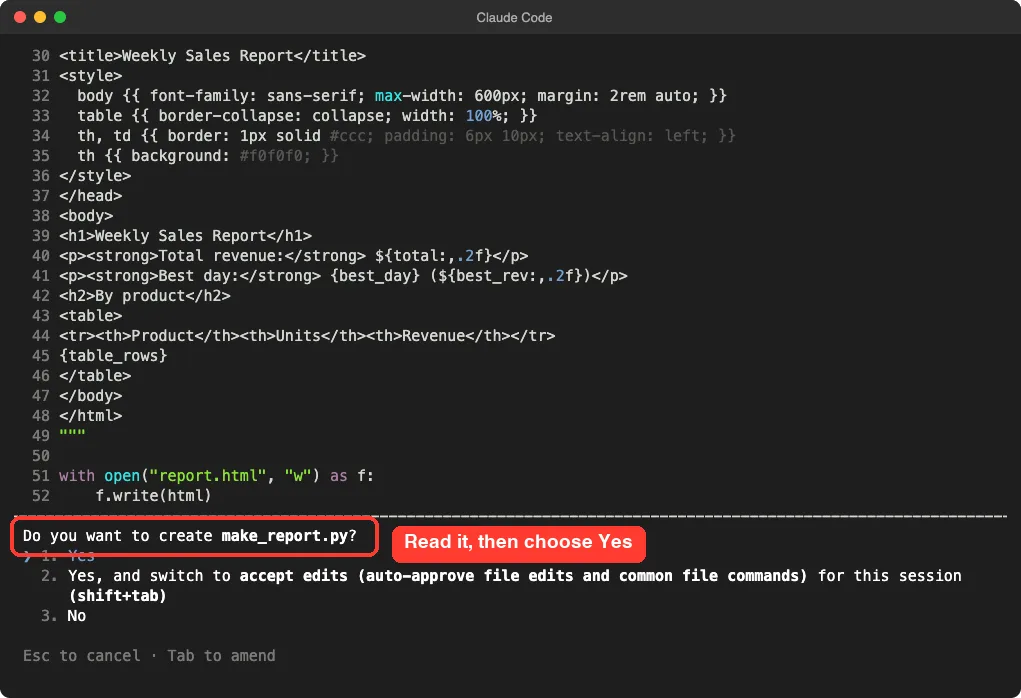
Claude Code showed us the whole script before it created the file, and then asked for permission. Read the question, because it names the file it wants to create.
We chose the first option, Yes. The second option approves edits for the rest of the session, which is handy later but not needed while you are learning.
Approve the Run
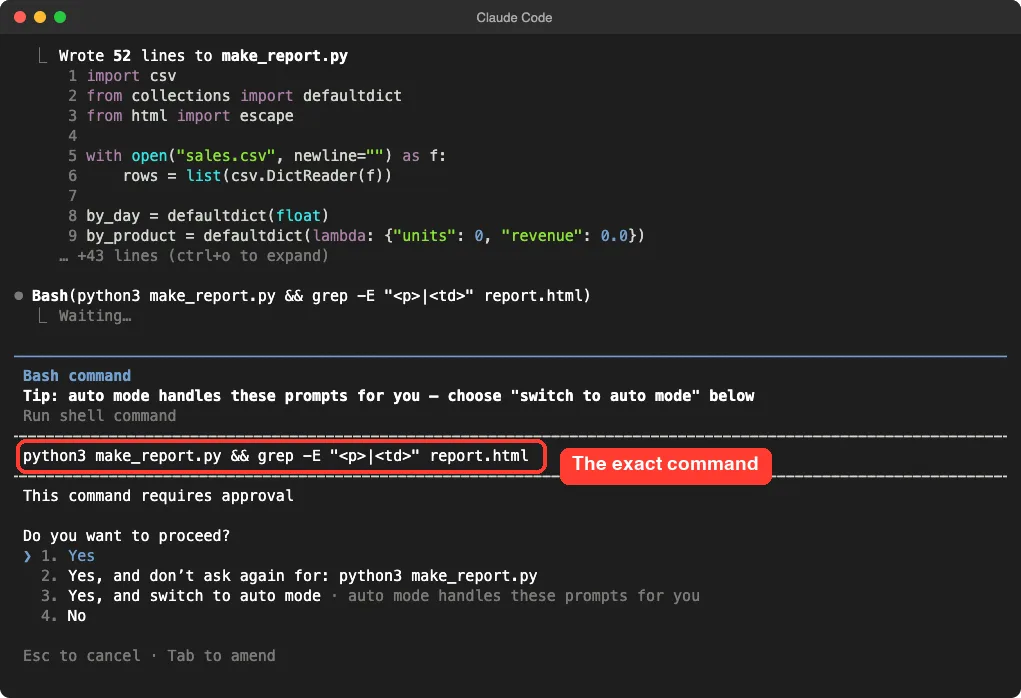
Next Claude asked to run the script. The command was python3 make_report.py, followed by a search of the finished page to check the numbers.
This is the moment to read the exact command. If it only runs the script you just saw, answering Yes is safe.
Step 2: Check the First Report
The whole first run took about ten seconds. Claude reported total revenue of $7,544.00, a best day of October 22 with $1,341.00, and a table of units and revenue for each of the four products.
Do not trust the numbers just because they look neat. We added up the notebook row by hand, and 223 units at $12 each is $2,676, which matches the table.
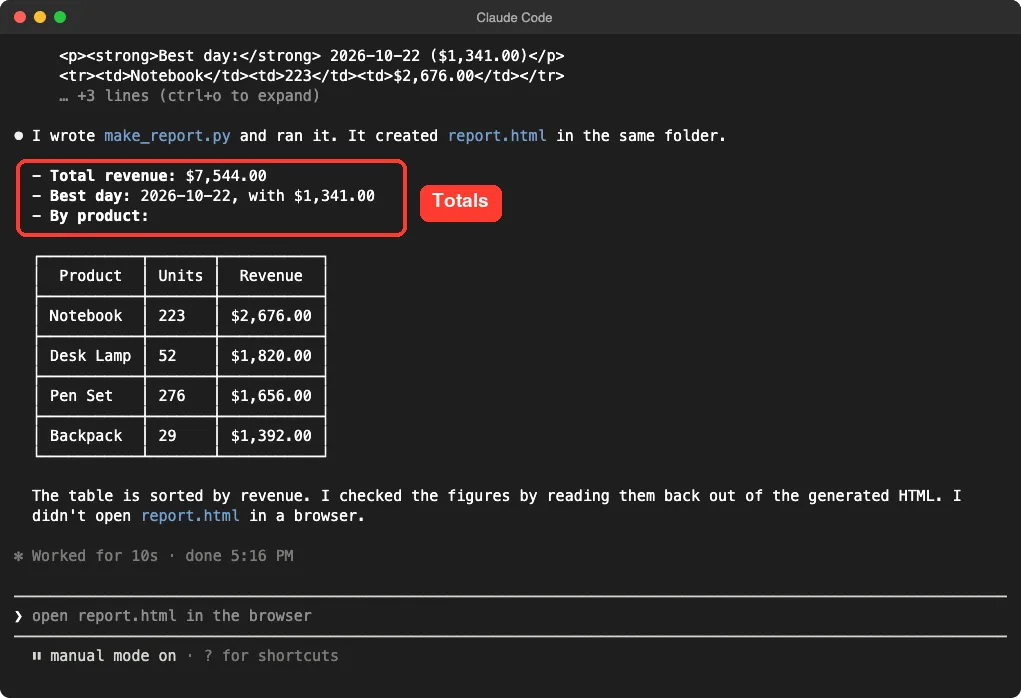
Claude also said it had not opened the page in a browser. That honest note is a good reminder to open report.html yourself and look at it.
Why One Spot Check Matters
A script does exactly what its code says, which may not be exactly what you meant. A quick hand check of one product or one day catches a wrong column or a wrong formula early, before you send the report to anyone.
Step 3: Add a Comparison With Last Week
A single week of numbers is useful, but a comparison is better. We put a made-up file called last-week.csv in the folder and asked for one more line.
Add one more line to the report: this week's total revenue compared with last week's, as a percent change. Last week's numbers are in last-week.csv. Update make_report.py and run it.Claude read the existing script, added a few lines that read the second file, and worked out the percent change. It showed us each edit before changing the file, which kept us in control.
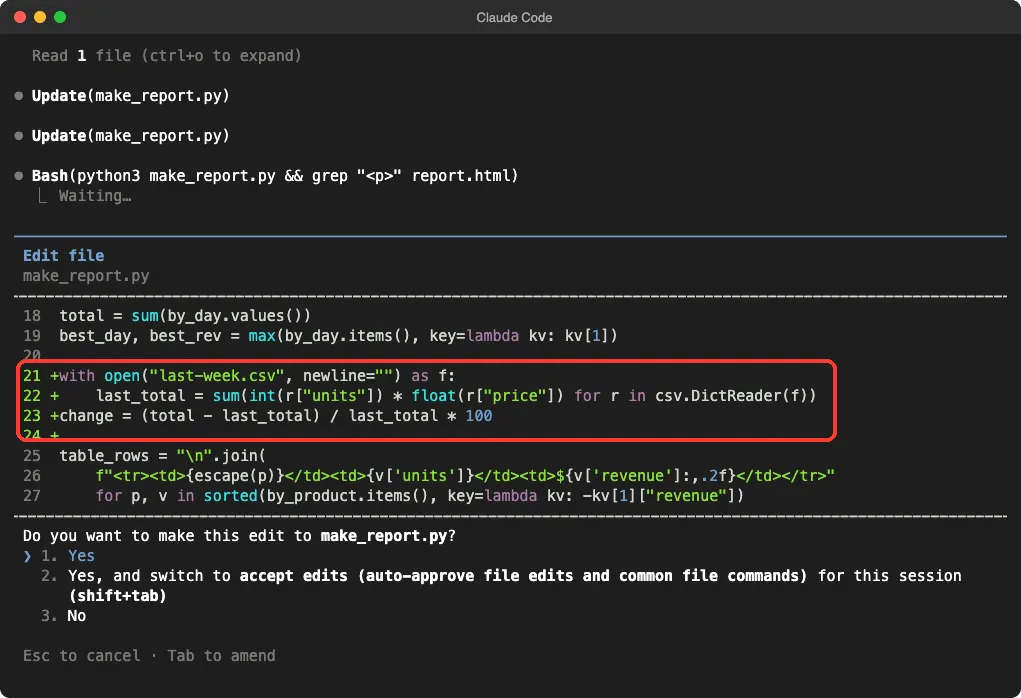
We asked for one small change at a time on purpose. Small requests are easier to check than one giant request, and if something goes wrong you know which change caused it.
Step 4: Open the Finished Report
After the edits, we ran python3 make_report.py ourselves in the terminal, which is exactly what you will do every week. The new line read +12.6%, with $6,697.00 the week before.
We checked it by hand too: 7,544 minus 6,697 is 847, and 847 divided by 6,697 is about 12.6 percent.
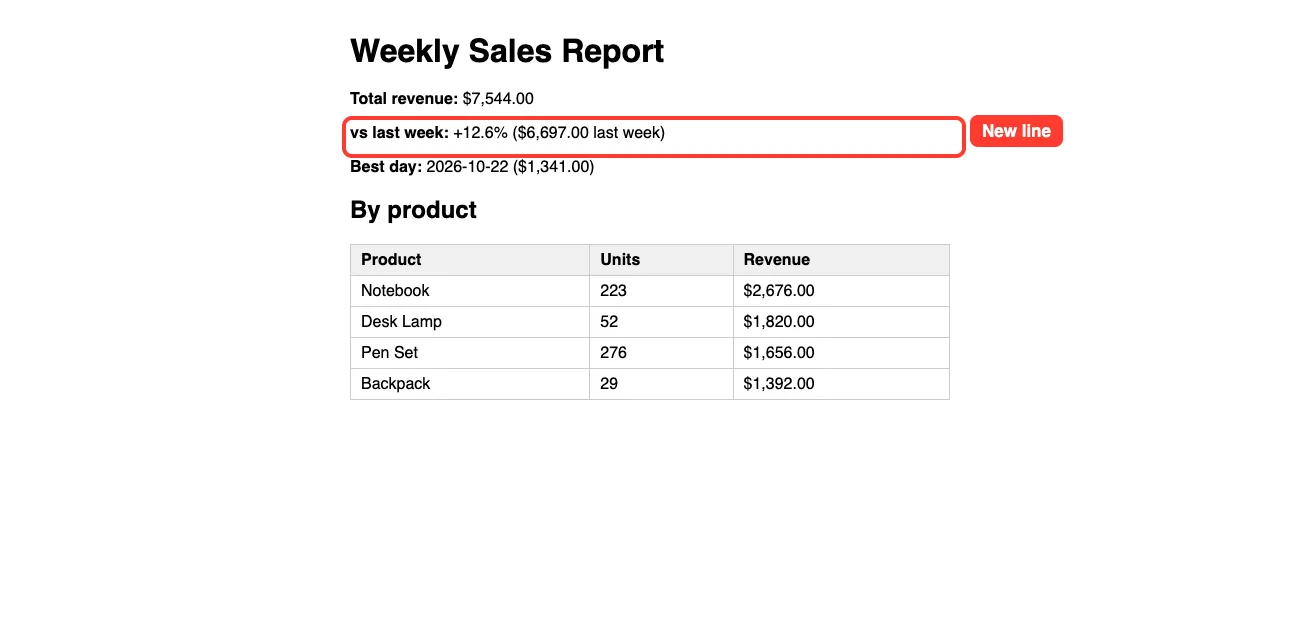
The page is plain on purpose. You can ask Claude to change the colors, add a company name, or put the table first, one request at a time.
Your Weekly Routine to Automate Reports
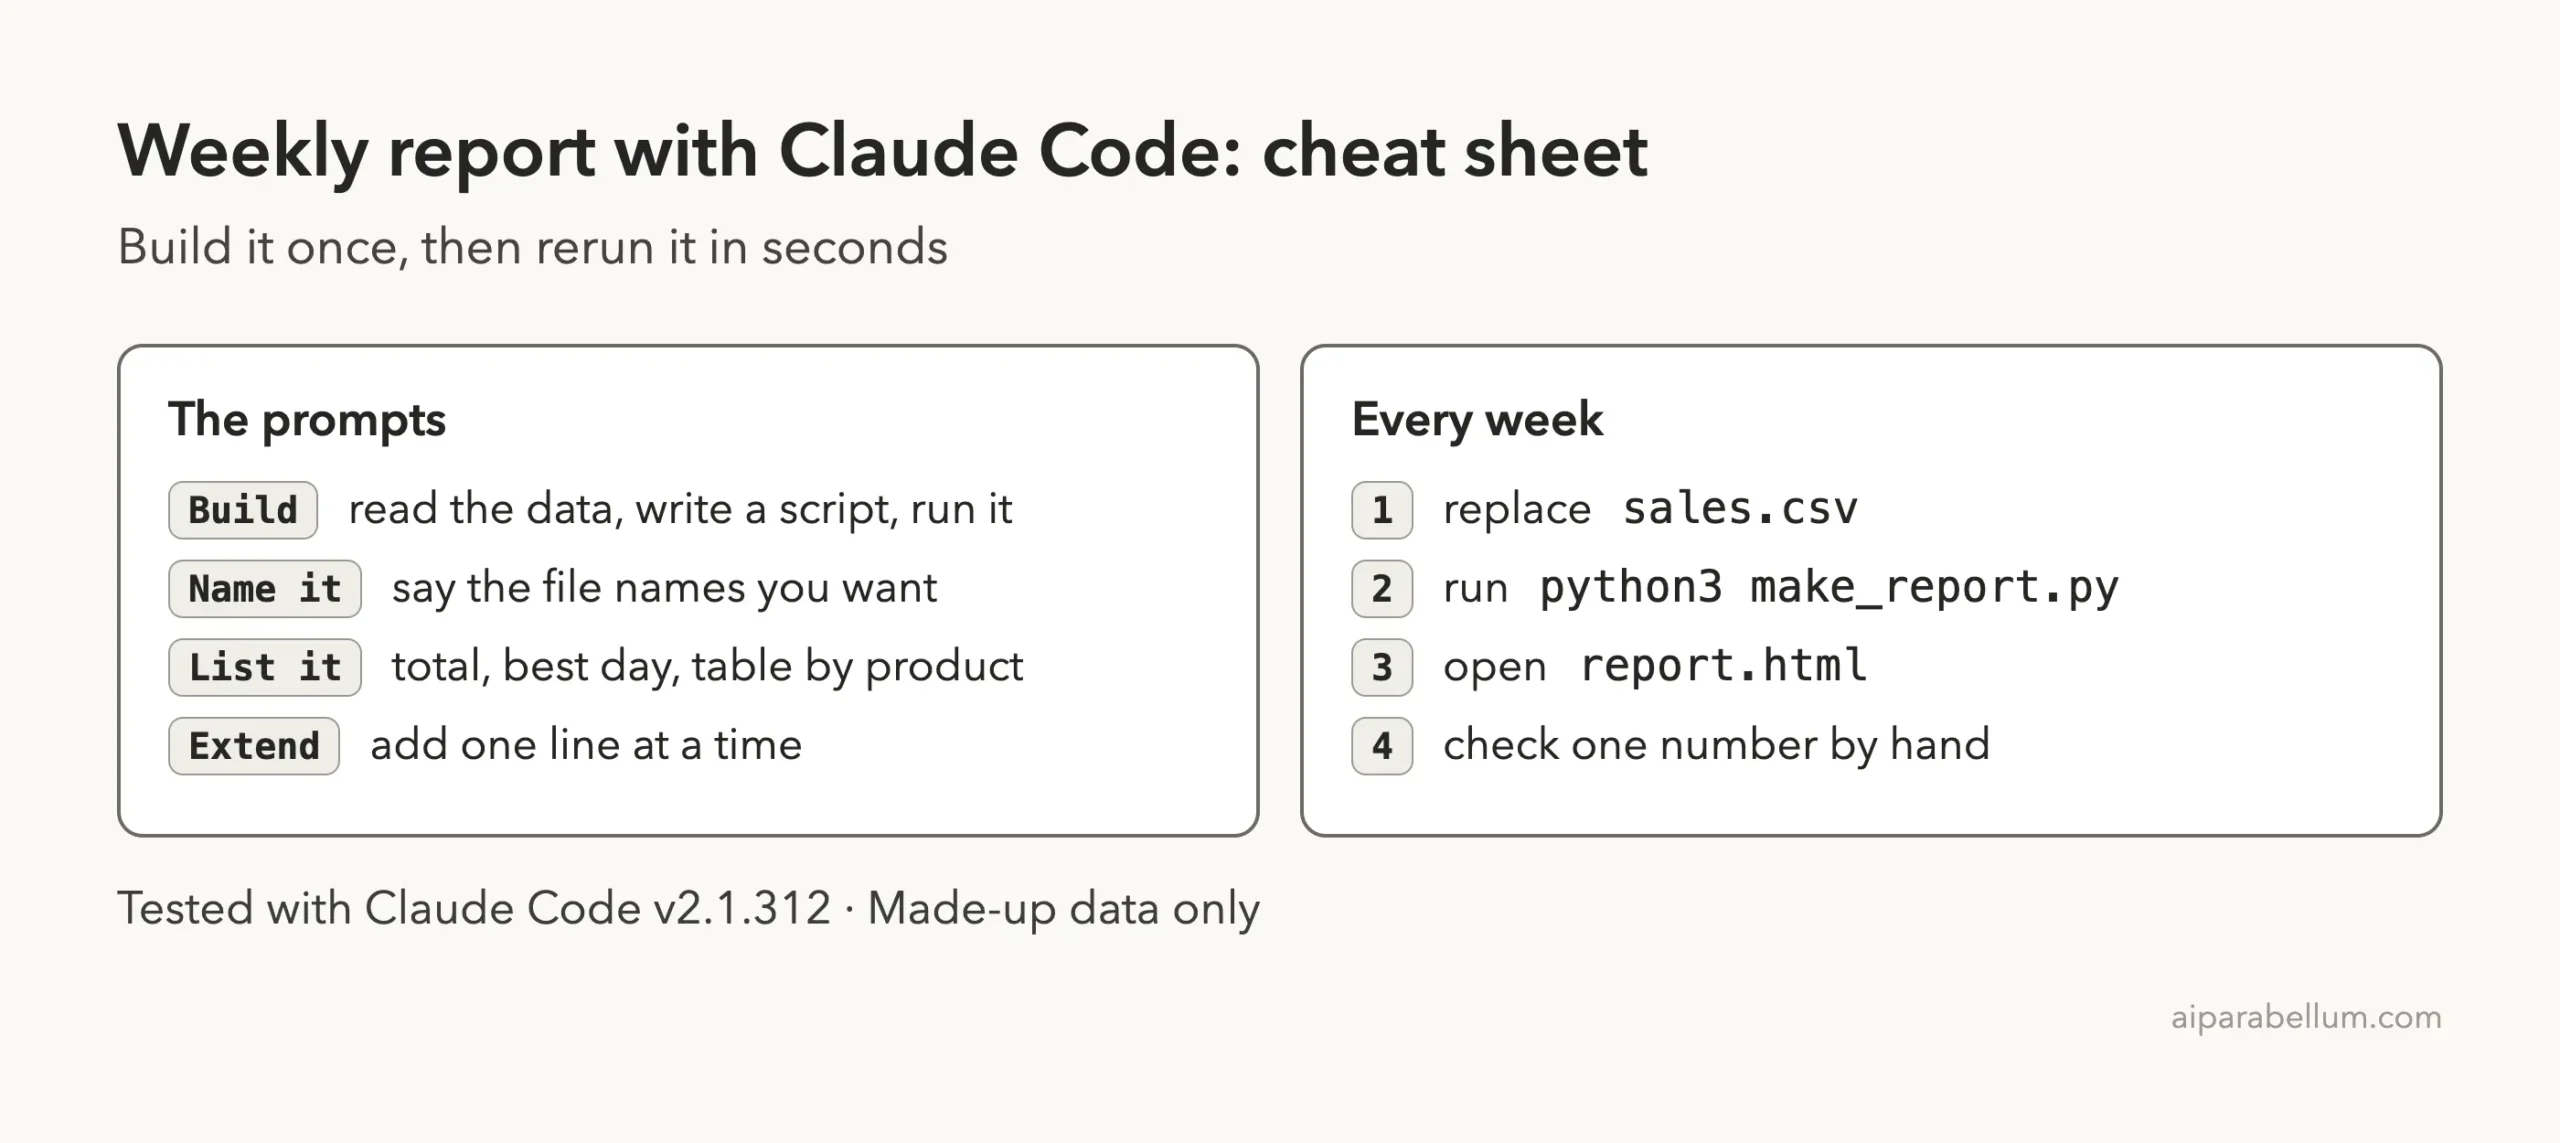
Once the script exists, you do not need Claude Code open at all. The routine is four small steps.
- Replace
sales.csvwith the new week’s file, using the same column names. - Move the old numbers to
last-week.csv. - Run
python3 make_report.pyin the folder. - Open
report.htmland check one number.
Keep the column names identical every week. If your spreadsheet changes shape, open Claude Code again and ask it to update the script.
What About Running It on a Schedule
Anthropic’s documentation describes a few ways to run prompts on a schedule. The /loop command and the built-in scheduling tools only fire while Claude Code is open and idle, so closing the terminal stops them.
For work that must run unattended, the docs point to cloud scheduled tasks, GitHub Actions, and desktop scheduled tasks. We did not set these up in this test, so check the official page before you rely on one.
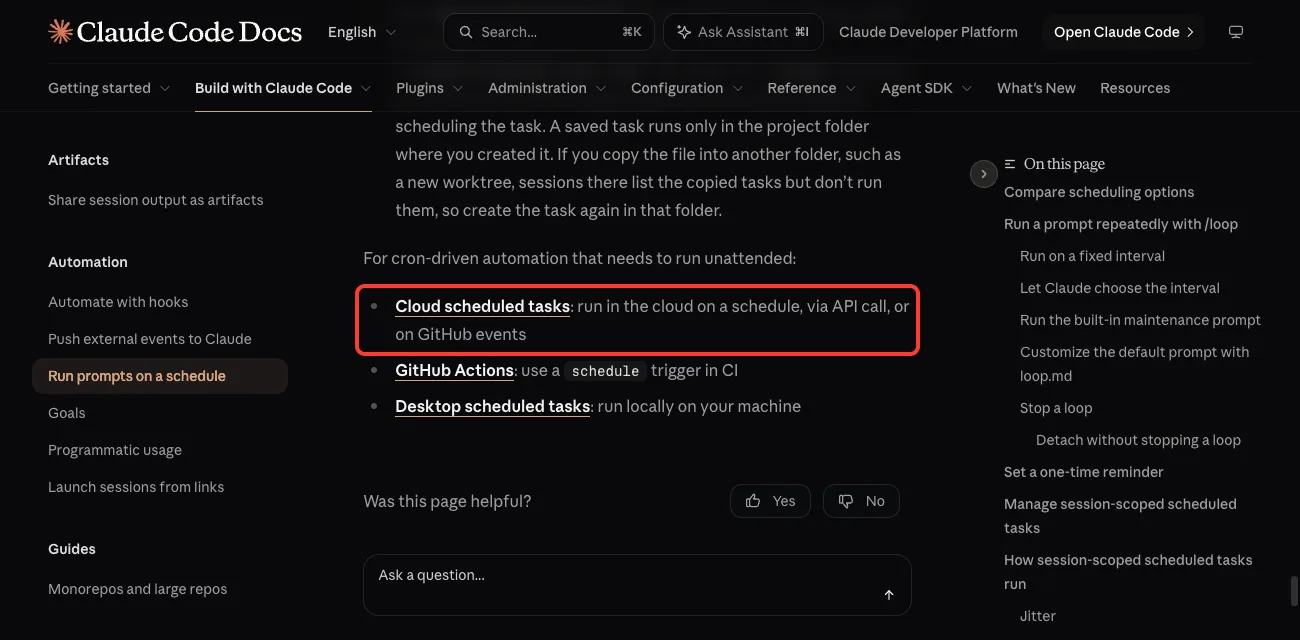
You can read the full guide in the scheduled tasks documentation. Anthropic also publishes common workflows with more everyday recipes.
Try It Yourself
Make a tiny spreadsheet of your own, such as a week of expenses, workouts or study hours, and save it as CSV in a practice folder. Then start Claude Code and paste this prompt, changing the file name and columns.
Read expenses.csv. It has one week of made-up spending (date, category, amount). Write a small Python script called make_report.py that writes a one-page report.html with the total spent, the most expensive day, and a table of the total per category. Then run it.When it works, ask for one extra line, such as a comparison with a second file. If you like spreadsheets, our guide to spreadsheet charts shows a visual version of the same idea.
Common Mistakes
- Skipping the hand check. Always verify one number yourself before you share a report.
- Changing column names. The script looks for the exact headers, so renaming
unitstoqtywill break it. - Asking for too much at once. Add one feature per prompt so you can see what each change did.
- Using real private data while learning. Practice with made-up numbers first, and read the proposed commands before approving.
- Forgetting last week’s file. A comparison only works if the old numbers are saved before you replace them.
Pro Tips
- Tell Claude the file names and column names in your prompt, so it does not have to guess.
- Ask Claude to explain the script in plain English after it writes it. You will understand what your report is doing.
- Keep a copy of the script in a safe folder. It is a small file, and it is worth backing up with the ideas in our folder backup tutorial.
- Rename the output with the date, for example
report-2026-10-26.html, if you want to keep a history. - If data is messy, clean it first. Our email list cleanup shows how.
Cheat Sheet
Frequently Asked Questions
Can I automate reports with Claude Code without knowing how to code?
Yes. In our test we only typed plain English, read what Claude proposed, and approved it. We never wrote code ourselves.
Do I need Claude Code open every week?
No. Once make_report.py exists, you can run it from a terminal on your own. You only need Claude Code again when you want to change the report.
Can it make a PDF or an Excel report instead?
You can ask for a different output, but we only tested an HTML page in this tutorial. Try one format at a time and check the result.
Is my data sent anywhere?
Claude reads the files you let it read, and that content is part of the conversation. Our data was made up, so use practice data until you are comfortable with what you share.
Can Claude Code run the report automatically every Monday?
The documentation describes scheduling options, and some only work while Claude Code is open. We did not test them, so read the official page first.
Conclusion
You can automate reports with Claude Code by describing the report once, approving a small script, and rerunning it each week with new data. In our test, two short prompts produced a working report with totals, a best day, a product table and a week-over-week comparison. That wraps up our series, so browse the rest of our Claude Code tutorials and learn more about the tool on our Claude page.
Previous in the series: Part 9: Find Duplicate Files on Your Computer With Claude Code